
Operations | Monitoring | ITSM | DevOps | Cloud

What's new and coming in Redgate Monitor: AI, CIS compliance and cloud migration

This webinar covers what's new and coming in Redgate Monitor: AI with Redgate Assistant and the Redgate Monitor MCP server, CIS benchmark compliance checks and security alerting (Enterprise), AWS cloud migration advice for SQL Server workloads, and the roadmap into 2027. Redgate Monitor has shipped a lot this year, and there's more landing before the end of it. This session walks through what's new, what's coming over the next few months and into 2027, and what it all means for how you run your estate. Roadmap items are current direction, not commitments.

Scout Monitoring Is Now in Claude's Connector Directory

A customer messages support: checkout feels slow today. You open Scout, find the endpoint, open a trace, spot the query, copy it into Claude, and ask what’s wrong with it. Each step is quick, but together they add up to a lot of tab switching to answer one question. Scout Monitoring is now available in Claude’s connector directory. Connect it once and Claude can look at your production data directly.

Introducing AI Observability: Trace Every AI Agent Request from Prompt to Pod

TL;DR Logz.io AI Observability provides end-to-end tracing for AI agents and LLM applications. Built on OpenTelemetry, it lets you trace every request from prompt to backend service, visualize multi-step agent execution, isolate root causes across models and infrastructure, and track token usage per step, all alongside your existing logs, metrics, and traces.

What is Distributed Tracing? How a Request Becomes a Trace

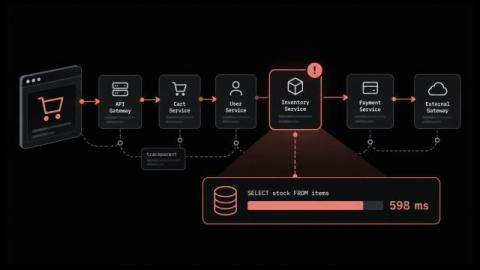
A checkout request leaves the browser and touches seven services before anything comes back. Seven dashboards light up. Every one of them reports a healthy number for its own service, and every one of them is telling the truth about a different slice of the work. Nobody measured the request. That gap is what pushed tracing in beside metrics and logs as a core signal of observability. In this blog, you will: By the end you will open a trace and say where the time went.

What is Jaeger Tracing and How does It Locate Slowdowns Across Microservices

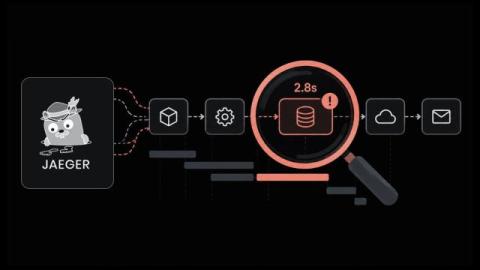
Why does a checkout or login take several seconds when CPU and memory look normal on every server? In microservices, one click can travel through a long chain of components before the user sees a response. Any one of them can hold the request up, and server graphs won't tell you which. Logs show what each service recorded. Metrics give you averages. What's missing is the path one request took and the place it lost time, and Jaeger tracing records exactly that.

Agentic AI Projects Die in the P&L Review. Here's How Revenue Leaders Can Keep Them Alive

‍‍Gartner expects more than 40% of agentic AI projects to be canceled by the end of 2027. Its reasons read like a budget memo: escalating costs, unclear business value, and inadequate risk controls. For revenue leaders, the stakes run in both directions. MGI Research estimates that at least 3% to 5% of revenue leaks between contract and cash, through missed renewals, unbilled usage, and pricing errors. Agents are well suited to close those gaps.

AI Changed How We Work. It Didn't Change What Your Platform Needs to Do.

If you've spent any time in an engineering Slack lately, you've probably noticed that AI comes up in just about every conversation. Someone's using an assistant to scaffold a new service. Someone else has an agent triaging alerts overnight. And at least one person is asking whether all of this means the team can finally skip the "platform stuff.".

Bring Your Own Identity Provider to Harness MCP

Learn how Harness MCP OAuth proxy mode enables enterprise developers to use their own identity provider without static tokens or shared credentials. OAuth proxy mode lets enterprises run Harness MCP behind their own identity provider, with no static tokens anywhere in the chain. Coding agents write the change. Harness agents take it through production, running the builds, tests, scans, and deployments that follow, with policy enforced on every action.

php2shell: the flaw hiding all across the web

Discover how php2shell vulnerabilities expose PHP servers to remote code execution and how Harness virtual patching protects endpoints while you deploy fixes. On October 21, 2026, the PHP project rushed out emergency patches for two critical flaws nicknamed php2shell (CVE-2026-109618 and CVE-2026-109619, both rated 9.2 out of 10). This isn't a bug in some plugin or a server someone set up wrong. It's in PHP itself, in the way the language has handled errors since 2012.

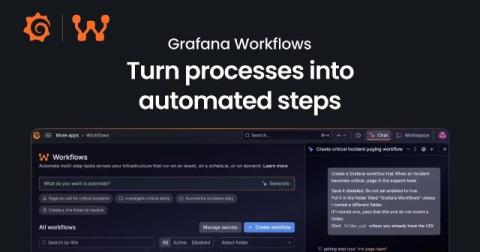
Spend less time on operational busywork and resolve incidents faster with Grafana Workflows

You're investigating checkout errors when someone asks who's coordinating the incident. Support needs an update, and another responder is looking for the runbook. You stop what you're doing to get everyone pointed in the same direction. They're all reasonable requests, but each one takes your attention away from understanding the problem. Yes, your team has a process for handling incidents, but carrying it out is another job for someone who's already busy.