Operations | Monitoring | ITSM | DevOps | Cloud

Datadog

Datadog Synthetic Monitoring now supports cross-browser testing

Your users access your application from a wide range of browsers, which have their own implementations of HTML, CSS, and JavaScript. For instance, many modern JavaScript features such as Promises and Arrow Functions are unsupported by some browsers. These inconsistencies can lead to missing elements and malfunctioning workflows that affect some—but not all—of your user base.

Monitor AWS App Runner with Datadog

Knowing how to deploy and run applications has become a key part of modern app development, meaning that developers need expertise in a number of areas beyond their core application code. Whether it’s container orchestration, networking, scaling, or load balancing, there is a steep learning curve to being able to deploy and run an application at scale.

Monitor JMeter test results with Datadog

Apache JMeter is an open source tool for load testing Java applications in both development and CI environments in order to ensure that sudden spikes in traffic won’t cause latency in production. But because load testing involves sending thousands of requests per minute in order to simulate real traffic, it can be difficult to parse outcomes and read patterns—especially for large organizations that test and deploy new code several times a day.

Correlate software performance and resource consumption with new saved views in Live Processes

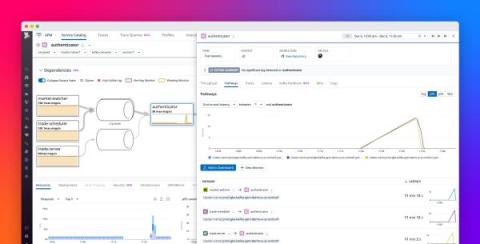
Your applications rely on third-party software running throughout your infrastructure, and it can be challenging to monitor each of these technologies individually. To give you the visibility you need, Datadog Live Processes now monitors all of your third-party workloads in one place.

Add Datadog monitoring to your Retool apps

The more tools that your teams need to execute their workflows, the more friction and lost productivity there can be, especially if each tool requires a different CLI or set of APIs. Retool is a low-code platform that allows you to build internal web applications using a drag-and-drop interface. By integrating with a number of key backend databases and APIs, Retool enables you to create custom, centralized management tools to serve a wide range of employee-facing use cases.

Best practices for monitoring dark launches

A dark launch is a deployment strategy for testing new versions of a service in production. When running a dark launch, you deploy a new version of a service and route a copy of production traffic to it without returning responses to users. This lets you see how a new version of a service handles production load, watch for errors, and compare performance between the old and the new versions—without affecting users.

Monitor Cloudflare logs and metrics with Datadog

Cloudflare is a content delivery network (CDN) that organizations across industries use to secure the reliability of their websites, applications, and APIs. With a wide array of security, networking, and performance-management tools, millions of web applications employ Cloudflare’s DDoS protection, load balancing, and serverless compute-monitoring features to maintain high performance and uptime.

Speed up your dashboard workflow with dynamic template variable syntax

Template variables enable you to use tags to filter your Datadog dashboards to the hosts, containers, or services you need for faster troubleshooting. However, there are some cases where it may be difficult to use a standard set of template variables to aggregate all of the data you need without creating a complicated, difficult to manage set of variables. For example, you may use tag values that are a subset of another tag.

Best practices for modern frontend monitoring

Single-page applications (SPAs) provide some significant benefits over multiple-page apps. For JavaScript developers using frameworks like React or Vue, they offer flexibility in moving application logic to the frontend, reducing the need for complex backend operations. For users, SPAs can provide a smooth experience with a highly interactive UI and fewer page loads. But, with increased sophistication, there are some tradeoffs.

Monitor kube-state-metrics v2.0 with Datadog

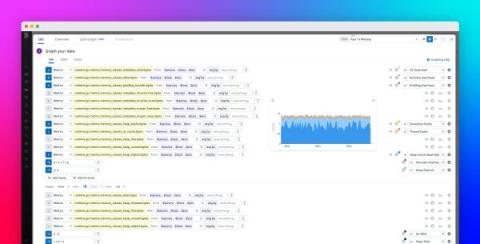
In order to manage complex containerized applications, modern devops teams need to have deep visibility into the status of their Kubernetes resources. By listening directly to the Kubernetes API, the open source kube-state-metrics service generates key metrics about your Kubernetes objects, including pods, nodes, and deployments, which are essential for understanding the status and performance of your clusters.