Operations | Monitoring | ITSM | DevOps | Cloud
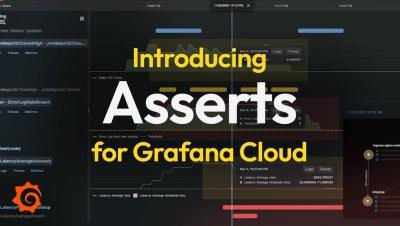
Introducing Asserts for Grafana Cloud | Grafana
Learn how Asserts for Grafana Cloud adds a layer of intelligence to your telemetry data, helping you understand the behavior of your applications and services. By automatically correlating issues when a problem happens, teams can cut through the noise to quickly find root cause.
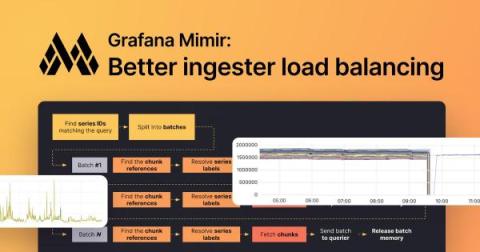
How we improved ingester load balancing in Grafana Mimir with spread-minimizing tokens
Grafana Mimir is our open source, horizontally scalable, multi-tenant time series database, which allows us to ingest beyond 1 billion active series. Mimir ingesters use consistent hashing, a distributed hashing technique for data replication. This technique guarantees a minimal number of relocation of time series between available ingesters when some ingesters are added or removed from the system.
Grafana 10.4 release: Grafana Alerting improvements, visualization updates, new plugin, and more
Grafana 10.4 is here! The latest version of Grafana introduces feature updates, a new plugin, as well as provides a preview of functionality we intend to make generally available in Grafana 11, which will be featured at GrafanaCON 2024 in April. Download Grafana 10.4 Until then, the Grafana 10.4 release includes upgrades to the canvas, geomap, and table visualizations. There is also a quicker way to set up alert notifications in Grafana Alerting and a new UI for configuring SSO.
Introducing Self-Serve Configuration Options for OAuth in 10.4 (UI, Terraform & Via API) | Grafana
Grafana 10.4 introduces self-serve configuration options for OAuth, to make setting up SSO for your Grafana instance simple and fast. All of the currently supported OAuth providers are now available for configuration through the Grafana UI, Terraform, and via the API. In this video, we show you how to configure Oauth in Grafana’s UI. ☁️ Grafana Cloud is the easiest way to get started with Grafana dashboards, metrics, logs, and traces. Our forever-free tier includes access to 10k metrics, 50GB logs, 50GB traces and more. We also have plans for every use case.
How to visualize SurrealDB data with Grafana
Whether your data is on the moon or in your basement, Grafana has got you covered. As the go-to platform for monitoring and observability, Grafana has been your trusty sidekick for data visualization for years, in part because we’re always looking for new ways to support our users, no matter where they keep their data. That’s why we’re excited to tell you about our latest supported data source — SurrealDB.
Creating visualizations with Grafana | Grafana for Beginners Ep. 9
Creating visualizations is one of the most effective ways to understand your data. Join Senior Developer Advocate, Lisa Jung to learn how to create gauge, time series line graph, stats, logs, and node graph visualizations using Grafana. The following are covered in this episode: ☁️ Grafana Cloud is the easiest way to get started with metrics, logs, traces, dashboards, and more. We have a generous forever-free tier and plans for every use case.
Grafana vs Splunk - Key Features and Differences
Grafana and Splunk are both used as monitoring tools. But while Grafana is majorly used as a data visualization tool, Splunk is an enterprise security and observability platform. Monitoring tools are essential for any business that wants to have visibility into its IT infrastructure. They provide real-time data that can be used to identify and troubleshoot problems. Grafana and Splunk are two of the most popular monitoring tools on the market. So, which one is better for your business?
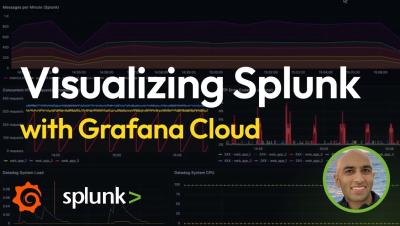
How to Visualize Splunk with Grafana Cloud | Grafana
Visualize logs & metrics from Splunk using Grafana Cloud and the Splunk plug-in. Connect securely to a private Splunk server using Private Datasource Connect. This video covers: ☁️ Grafana Cloud is the easiest way to get started with metrics, logs, traces, dashboards, and more. We have a generous forever-free tier and plans for every use case.
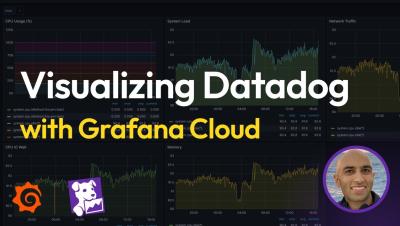
How to Visualize Datadog Metrics with Grafana Cloud | Grafana
This video covers visualizing Datadog metrics using Grafana Cloud and the Datadog plug-in. Grafana Cloud allows you to visualize data from all of your observability tools in a single place. ☁️ Grafana Cloud is the easiest way to get started with metrics, logs, traces, dashboards, and more. We have a generous forever-free tier and plans for every use case.


