Operations | Monitoring | ITSM | DevOps | Cloud
Debugging Java Equals and Hashcode Performance in Production
I wrote a lot about the performance metrics of the equals method and hash code in this article. There are many nuances that can lead to performance problems in those methods. The problem is that some of those things can be well hidden. To summarize the core problem: the hashcode method is central to the java collection API. Specifically, with the performance of hash tables (specifically the Map interface hash table). The same is true with the equals method.
Interview with Tom Granot - Developer Observability, KoolKits and Reliability
In preparation for the upcoming Developer Observability Masterclass we’re hosting at Lightrun with Thoughtworks and RedMonk, I sat down for a brief interview with Tom Granot – the Director of Developer Relations at Lightrun. Tom will MC the event as he did for the Developer Productivity Masterclass we ran back in December.
Debugging Race Conditions in Production
Race conditions can occur when a multithreaded application accesses a shared resource using over one thread. Unless we have guards in place, the result might depend on which thread “got there first”. This is especially problematic when the state is changed externally. A race can cause more than just incorrect behavior. It can enable a security vulnerability when the resource in question can be corrupted in the right way. A good example of race condition vulnerabilities is mangling memory.
Effectively Bridging the DevOps - R&D Gap without Sacrificing Reliability
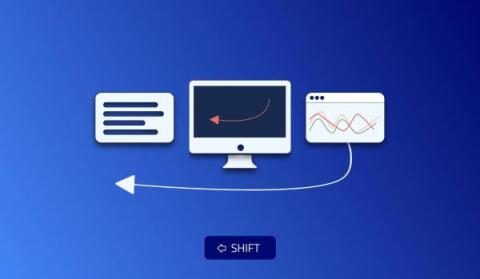
DevOps culture revolutionized our industry. Continuous Delivery and Continuous Integration made six sigma reliability commonplace. 20 years ago we would kick the production servers and listen to the hard drive spin, that was observability. Today’s DevOps teams deploy monitoring tools that provide development teams with deep insight into the production environment. Before DevOps practices were commonplace, production used to fail. A lot.
Lightrun For Visual Studio Code
Get Lightrun for Visual Studio Code:
https://marketplace.visualstudio.com/items
Lightrun Releases KoolKits - Debugging Toolkits for Kubernetes
KoolKits (Kubernetes toolkits) are highly-opinionated, language-specific, batteries-included debug container images for Kubernetes. In practice, they’re what you would’ve installed on your production pods if you were stuck during a tough debug session in an unfamiliar shell. To briefly give some background, note that these container images are intended for use with the new kubectl debug feature, which spins up Ephemeral containers for interactive troubleshooting.
KoolKits - Highly-opinionated, batteries-included Kubernetes debugging toolkits
Full-Cycle Observability With Instana and Lightrun
Understanding everything that happens inside a production environment is a notoriously difficult task. Instana’s solution helps developers and DevOps become aware of problems quickly – problems that are rooted in both infrastructure-level information and application-level information. Lightrun, on the other hand, enables practitioners to drill deeper into line-by-line, debugger-grade information from your production systems – enriching the existing information Instana delivers.
Lightrun Announces GA Support for Visual Studio Code
Lightrun is the world’s first IDE-native observability platform. A developer-first product, Lightrun enables engineering teams to connect to their live applications and continuously identify critical issues without hotfixes, redeployments, or restarts. We are proud to announce the general availability of the Lightrun extension for Visual Studio Code, the popular IDE from Microsoft.


