Operations | Monitoring | ITSM | DevOps | Cloud

MetricFire

Kafka Monitoring Using Prometheus

In this article, we are going to discuss how to set up Kafka monitoring using Prometheus. Kafka is one of the most widely used streaming platforms, and Prometheus is a popular way to monitor Kafka. We will use Prometheus to pull metrics from Kafka and then visualize the important metrics on a Grafana dashboard. We will also look at some of the challenges of running a self-hosted Prometheus and Grafana instance versus the Hosted Grafana offered by MetricFire.

Complete Guide To Grafana Dashboards

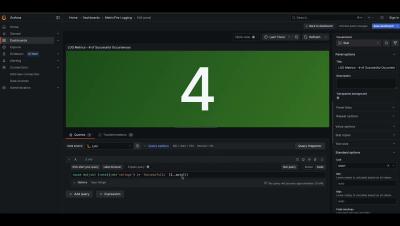
Grafana is one of the most popular dashboarding and visualization tools for metrics. The Grafana Dashboards are a very important part of infrastructure and application instrumentation. In this post, we will deep dive into Grafana dashboards. We will create a Grafana dashboard for a VM’s most important metrics, learn to create advanced dashboards with filters for multiple instance metrics, import and export dashboards, learn to refresh intervals in dashboards and learn about plugins.

Grafana vs. Zabbix

Grafana is a visualization tool that allows you to see and analyze all of your metrics in one unified dashboard. Grafana can pull metrics from any source, display that data, and then enable you to annotate and understand the data directly in the dashboard. Grafana dashboards are designed to allow you to visualize information in a ton of ways, from histograms and heatmaps to world maps. Grafana also has an alerting feature that can communicate with you through Slack, PagerDuty, and more.

Use Grafana to Monitor Flask Apps With Graphite

Monitoring the performance and health of web applications is paramount for ensuring a seamless user experience. Flask offers developers the flexibility to build dynamic applications. However, as applications grow in complexity, so does the need for efficient monitoring solutions. This is where Grafana and Graphite come into play.

Tutorial: Monitoring MySQL Server Performance with Prometheus and sql_exporter

Databases in one form or another are almost an inseparable part of modern applications. A popular one among them is MySQL on which this article will focus. But how to monitor MySQL? This article will give an introduction to this topic.

Prometheus Dashboards

Prometheus is a very popular open-source monitoring and alerting toolkit originally built in 2012. Its main focus is to provide valid insight into system performance by providing a way for certain variables of that system to be monitored. Prometheus displays the performance of these variables as a graph to allow its users to see their system’s performance at a glance.

Our Favorite Grafana Dashboards

Grafana is an open-source visualization and analytics tool that lets you query, graph, and alert on your time series metrics no matter where they are stored - Grafana dashboards provide telling insight into your organization. All data from Grafana Dashboards can be queried and presented with different types of panels ranging from time-series graphs and single stats displays to histograms, heat maps, and many more.

Monitoring your infrastructure with StatsD and Graphite

Collecting metrics about your servers, applications, and traffic is a critical part of an application development project. There are many things that can go wrong in production systems, and collecting and organizing data can help you pinpoint bottlenecks and problems in your infrastructure. In this article, we will discuss Graphite and StatsD, and how they can help form the basis of monitoring infrastructure.