Operations | Monitoring | ITSM | DevOps | Cloud

MetricFire

Heroku Monitoring: Best Practices

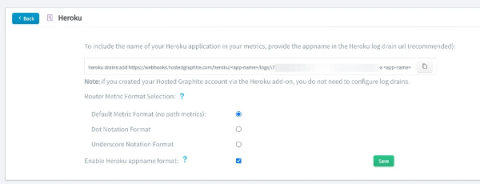
When you immerse yourself in the world of application development, you'll find that deploying applications on Heroku comes with a certain level of ease. However, monitoring becomes a non-negotiable element to keep these applications running at their best. It's like having a clear aerial view of your application's performance - it helps you spot potential performance hurdles and handle issues proactively.

Enhancing Your Heroku Postgres Performance: A Guide to Effective Monitoring with Hosted Graphite

When it comes to managing your database, monitoring is crucial for maintaining data integrity, optimizing performance, and ensuring efficient resource allocation. In today's fast-paced technological landscape, having real-time insights into your database's health is more important than ever. This is where Heroku Postgres and Hosted Graphite come into the picture.

Hosted Graphite and Printers: Boosting Efficiency and Performance

Printers play a crucial role in various industries, helping businesses efficiently manage their document workflows. However, ensuring optimal printer performance and minimizing downtime can be a challenge. This is where hosted graphite comes into the picture. Hosted graphite is a powerful monitoring tool that allows businesses to graph metrics and gain valuable insights into their printer systems.

Ditch Nagios Errors for A Streamlined Alternative: "Return code of x is out of bounds"

In the realm of IT infrastructure monitoring, Nagios has long been a popular choice due to its robust feature set and flexibility. However, even reliable systems can encounter issues, and one recurring problem that Nagios users might encounter is the "Return code of x is out of bounds" error. In this blog post, we'll dive into the details of this error, what causes it, and how it can impact your monitoring efforts.

Unlocking the Power of Hosted Graphite and Machine Learning

Monitoring and optimizing IT infrastructure, applications, and networks is crucial for businesses in today's digital landscape. It allows them to proactively identify issues, ensure optimal performance, and deliver a seamless user experience. However, traditional monitoring methods often fall short when it comes to handling the increasing complexity and scale of modern systems. That's where hosted graphite and machine learning come into play.

Top Features of Grafana Versions 7 & 8

Grafana is a monitoring system that helps you visualize your infrastructure and provides notifications when errors occur. It offers interesting features on some versions as it's the case on v7 and v8. We will go through some that are very interesting in particular Panel editor, Tracing UI, bar graph, and visualization. With MetricFire specializing in hosted monitoring, you can easily make a Grafana dashboard by booking a demo or signing on to the free trial immediately.

Grafana vs. SolarWinds - The Dashboards

Dashboards are great ways to visualize different KPIs in a single place. Metrics from all over your system can be framed together and viewed on a single screen, helping to correlate them and reducing the overall effort of analysis. But when it comes to Grafana vs. SolarWinds, which one is better? It is often difficult to choose between their dashboarding capabilities. Both tools provide their own visualizations and help bring out interactive dashboards for users to use.