Operations | Monitoring | ITSM | DevOps | Cloud

Squared Up

Software Project Managers: get total visibility of all your tools

Project managing global software projects is always a challenge, contending with multiple time zones, tools, and teams. In these environments, the day-to-day life of a Project Manager is filled with status collections, project reporting, and little time for much else. While the detail will always matter – like team bug data, feature status, and build progress – there is a better way than collecting and reporting on all this data manually. Does this scenario sound familiar?

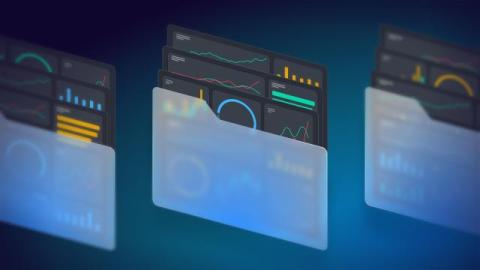
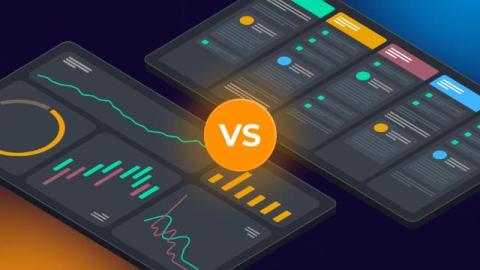
Status dashboards: Get visibility across teams and services all in one view

Applications are built and run by many people and made of many components: infrastructure, code pipelines and end users to name a few. Understanding the status of those components and teams is never straight forward. In this blog, we will be unpacking the problem faced by most organizations and taking a look at how SquaredUp can empower you and your organization with status visibility across different teams / components / services – all in one view.

3 reasons why reporting SLOs at scale is hard

I figure you’re doing okay with SquaredUp. It still works for you. Maybe you feel there are a couple of things that could be improved, but it’s not a big deal. So you’ve not upgraded yet. And frankly, because it all works fine and is still doing its job, you haven’t kept up to date on all the latest features rolled out in the SquaredUp updates. But…you’re missing out – on a lot.

How to get One-click SCOM Root Cause Analysis

SCOM has incredible powers, but it’s not always easy to find the root cause of issues fast. And you definitely don’t get one-click SCOM root cause analysis. We’ve all been there. A business-critical server goes down and you don’t know why. Let’s imagine you had a dashboard showing the health statuses of all your server groups and you notice that the United States is showing as critical.

How to build a dashboard for AppDynamics

We’re excited to announce that we’ve just released SquaredUp Dashboard Server 5.6! This Dashboard Server release covers multiple features that have been highly requested by the community. Prioritizing this user feedback, we’ve added some exciting new visualizations, features and enhancements. Read on to learn about the latest updates, or catch the full webinar recording at the bottom of the blog for a detailed demo by Senior Solutions Engineer Ashley Thompson.

How to build a dashboard for any AWS CloudWatch data

Looking to keep an eye on logs and metrics from AWS or CloudWatch? There are several reasons you might want to build a CloudWatch dashboard somewhere outside of the CloudWatch console: Whatever the reason, we’ve put together a write-up to help you plug into CloudWatch to surface any logs or metrics in one place, for easy alerting and sharing, using the SquaredUp observability portal. You can get your own SquaredUp account, just head over to squaredup.io/get-started to sign-up for a free account.

New release: SquaredUp 5.5

We’ve just released SquaredUp 5.5! As always, you’ll find some great new additional features as well as enhancements in the SquaredUp Community, Azure, and SCOM Editions. Plus, the new 5.5 release works with SCOM 2022. Here’s a quick overview of what’s new: Check out the release webinar here or keep reading for all the juicy details.

Monitoring Azure Stack HCI with SCOM 2022

SCOM 2022 has been recently made GA and I, coming from a SCOM background, was pretty interested in checking out the latest SCOM product. Luckily, Azure Stack HCI management packs were recently released too, so it was as if the stars had lined up for me to drop everything else and check out this new management pack with SCOM 2022. And that is exactly what I did!

Fixing SCOM's blind spots

Since its origins as MOM 2000, SCOM has been widely regarded for being awesome at two things: firstly, being the hands-down best solution for monitoring Windows Server environments (it is Microsoft’s monitoring tool, after all); and secondly, being an extensible monitoring platform that can act as a single pane of glass across your data center environment.