
Service Watch Browser Monitoring in Minutes!

You surf the internet, don’t you? While all of us are at home due to Covid lock-down and accepting a new reality, the majority of the work is happening online. IT managers are looking for tools that can track the user digital experience. Executives are reading a report from Gartner or Forrester about some of the best networking monitoring solutions available on the market. Project managers are using Microsoft Teams online to communicate and ensure team members are meeting deliverables on time. Remote employees everywhere use OWA to check their office mails. No matter what, you can be quite sure that everyone is using their favorite browser and search engine for connecting online and accomplish tasks.
Remote Work Requires Digital Experience Monitoring (DEM)
According to Forrester, remote work will rise to 300% of pre-Covid 19 levels as several companies begin to adopt a remote hybrid work mode. As a result, existing infrastructure like routers, switches, and other network devices will strain to provide optimal capacity to continue to support this vast remote workforce. IT executives will be under pressure to monitor their employee’s productivity and efficiency if they are serious about meeting their business goals. Moreover, technology teams will learn to adapt to a new model and invest in modern technology tools. Monitoring employee experience – applications and services – becomes a priority to drive business continuity, increase employee engagement and retention, and plan sustainable growth.
One way to meet this upcoming challenge for all of us is to deploy Real-User Monitoring (RUM) for SaaS, third-party applications, and web apps that we may not even own but want to monitor. SaaS monitoring becomes mission-critical when most end-users are dependent on remote tools such as Office 365 for productivity, collaboration and day-to-day work.
Service Watch Browser For The Win!
Exoprise Service Watch Browser (SWB) helps monitor business-critical services from the end-user’s perspective – by examining browser performance statistics only for the domains and websites that matter to IT, ensuring privacy while still caring for the digital experience and support. This browser extension is easily available to all or a subset of users with configurable filters to monitor a variety of websites. When users visit configured websites in their browser, Service Watch periodically monitors and retrieves performance such as availability and response time in the back-end dashboard.
Service Watch Browser for Digital Experience Monitoring supports the following list of browsers for end-user monitoring:
- Google Chrome
- Microsoft Edge
- Mozilla Firefox (coming soon)
End-users benefit from SWB in several ways. From recording browser sessions to assisting IT in diagnosing and troubleshooting slow applications, SWB captures actual end-user web experience and provides insights into the overall productivity state. Be sure to securely track any domain, application, internal or external cloud app and check performance 24*7 365 days a year.
- Reducing Troubleshooting Time – The browser extension captures and analyzes telemetry to determine whether SaaS web application is slow for a particular user or for the entire network. No matter where the end users are, SWB is the Go-To-Market solution for remote and roaming users who access enterprise applications such as Microsoft 365, Salesforce, Workday, Zoom, etc. daily. IT collects this data to isolate problems and quickly identify the best standard operating procedures for each case, saving time for everyone, and becoming efficient in troubleshooting.
- Increasing Resiliency – RUM helps to diagnose specific users or networks but cannot predict or notify when a user will be affected. CloudReady synthetic monitoring combined with Service Watch can help to retrieve a complete picture and correlate different perspectives. IT teams can know in advance when a failure will occur and inform all their customers immediately.
- Enhancing Digital Experience – With true network diagnostic information (network latency, web content availability, response, and request time, etc.) IT makes decisions quickly and works together to promote a greater experience for everyone. Remote teams are sometimes unsure as to where the fault lies in the entire network. Service Watch eliminates this blind spot and provides instant end-to-end visibility for slowdowns, poor performance, inherent network, or connectivity issues. Share detailed network metrics that capture hop-by-hop network path performance and low-level details internally among team members or externally to restore SLA credits.
Running Service Watch on end-user machines who work remotely or are mobile serves as a good starting point. Ultimately, IT needs to decide goals and objectives behind collecting the additional data. As more users continue to work from their homes, it would ultimately generate more rewards if SWB became part of your monitoring strategy.
- Mobile and Remote Users – These users should be the first to use SWB extensions in their browsers so that IT can measure the performance of existing or newly integrated cloud applications from the end-user’s perspective. Since these users are always on the move and prefer to work in environment agnostic settings, installing the extension would provide a real sense of application performance.
- Branch Office Users – Users in this category are people who work in offices or branch offices within different departments and connect to the corporate LAN/WAN. Common applications that these employees use are Salesforce, GSuite, Office 365, SharePoint, OneDrive, etc. Candidates from this pool range from business leaders to managers working on various aspects of SaaS applications.
- Network Administrators – IT administrators can also be acceptable pilot candidates by installing the SWB extension and monitoring real world user application performance in a lab setting. As early adopters, train admins in installing SWB and later deploy it to a broad audience for monitoring selective domains.
- Users Complaining of Slow Performance – For workers who are constantly facing slower application and connectivity issues, installing SWB extension would immediately show where the bottleneck lies.
Installation and setup of the SWB is easy and quick. Below are the steps required to embark on a successful and smooth journey with Service Watch.
- First, sign up for a Free 15-day Trial with Exoprise
Sign up at https://secure.exoprise.com
- Once signed in, start by adding a Service Watch configuration the “Real User Monitoring” area:
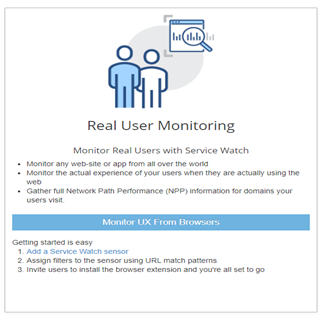
Follow the step-by-step directions under Real User Monitoring for Service Watch
- Invite users to install the Service Watch Browser extension from the Chrome Web Store or Microsoft Edge Web store. As an Exoprise administrator or trial user, you should try and install it yourself first. Select trial user candidates who may be working in different network environments or who may be experiencing SaaS/Microsoft 365 performance problems.
Invite users to Install Browser Extension/Add-on
- Configure Service Watch for SaaS Applications and Services by Domain (URL) to only monitor those domains. Use the pre-configured domains for GSuite, Microsoft 365 and Salesforce.
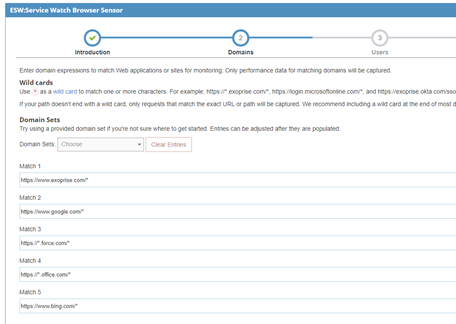
Choose from pre-configured domain filters for Microsoft 365, GSuite and Salesforce. Or enter your own websites and domains
- That’s it, you’re done!
Notice the extension installed in your Chrome browser (or new Microsoft Edge). The Service Watch Browser extension indicator will show green color when visiting configured domains otherwise the blue color indicating that the extension is not examining performance statistics for the domains.
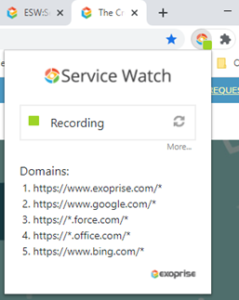
Example of the Service Watch Extension recording performance data for the configured URLs
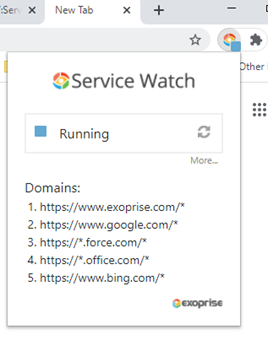
Example of the extension running but NOT recording data for the current web page
With the Service Watch Browser Dashboard, IT can now visualize performance and browsing activity data for individual domains or users in real-time. Select filters (client, server, network, DOM) and drill down to analyze slowness or other persistent affecting employees. Quickly understand where the fault lies across the service delivery chain by comparing it with benchmarks. Trends highlight how slow connectivity and network problems can affect users in various locations. Optimize digital experiences with newly discovered insights. Download the network navigation data in CSV format.
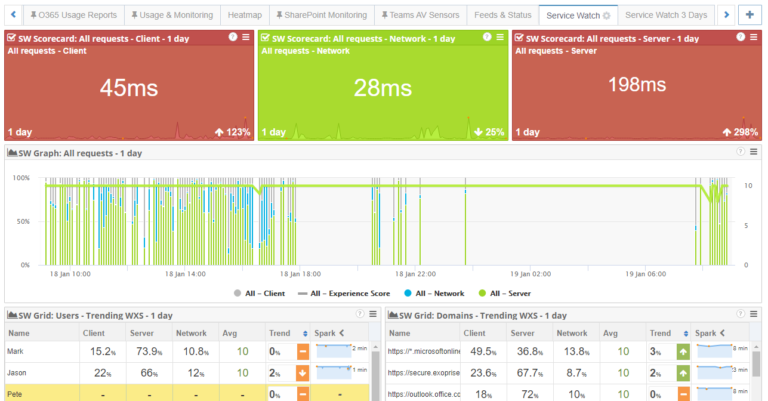
Create custom real-time digital experience monitoring dashboards
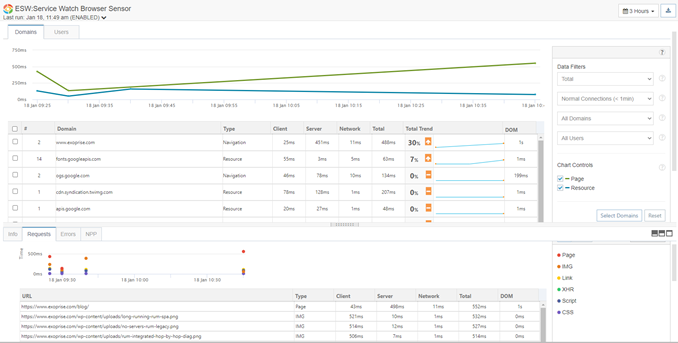
Drill down on specific domain sites to analyze performance issues (slowness, response time, etc.)
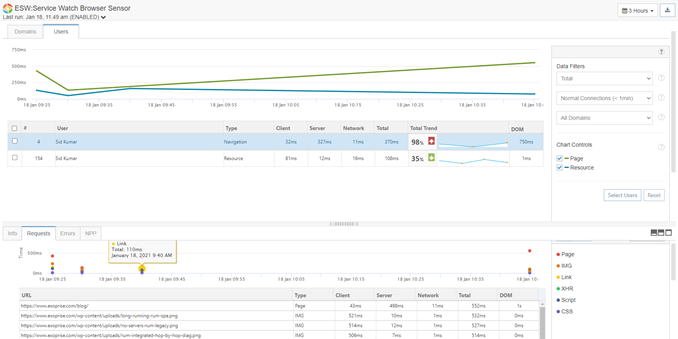
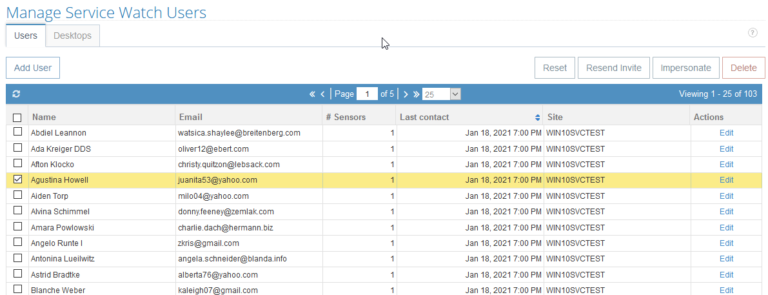
Drill down on specific users to track individual performance at multiple locations
Exoprise continues to innovate in the field of Digital Experience Monitoring and brings unique solutions to the market to generate positive experiences for the end-user. Interested in working for a fast-paced startup and influencing the community with your skills, then come and join us.