Operations | Monitoring | ITSM | DevOps | Cloud

N-central 2026.3 Release Roundup

Discover what's new in N-central 2026.3. This release focuses on helping IT teams operate more efficiently at scale with improvements to performance, filtering, agent management, security, and integrations. From faster device filtering and rule validation to enhanced agent upgrade workflows and stronger security controls, N-central 2026.3 delivers meaningful improvements designed to simplify day-to-day operations and improve platform reliability.

Availability, Performance and Behavior : The Big Picture of Network Intelligence

In this session, we will introduce the third dimension of network monitoring: behavioral intelligence built into the Progress WhatsUp Gold network monitoring solution. Where other tools, like SolarWinds and PRTG, require multiple modules, complex rule-writing, integrations or additional overhead, the WhatsUp Gold solution uses AI-driven behavioral analysis to automatically baseline what’s normal in your network and unveils deviations early.

PagerDuty agent app in GitHub

PagerDuty's agent app shows live incident state, incident history and change correlations inside GitHub so you can get context right within your PR without interrupting your flow. Automatically correlate incident data with recent commits and deployments to identify root causes, then generate fix PRs with proper incident linking.#IncidentResponse.

More Resilience, Less Overhead: How to Modernize Disaster Recovery Testing

• Disaster recovery planning is essential for ensuring digital services remain online in the face of catastrophic failures or outages. When a major digital infrastructure outage occurs, systems need to be set up to automatically respond and restore functionality as quickly as possible. But no matter how in-depth your disaster recovery plan is, it’s still only theoretical until it’s thoroughly tested under realistic failure conditions, which is why testing is often mandated by leadership and regulators.

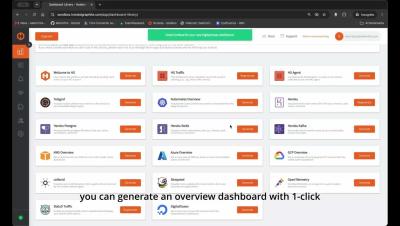
Monitor DigitalOcean in Grafana with MetricFire

Monitoring your DigitalOcean infrastructure just got easier. MetricFire now integrates natively with DigitalOcean, so you can connect your account and start streaming metrics from Droplets, Load Balancers, Managed Databases, and more directly into Grafana. No agents. No setup overhead. No dashboard stitching. Get full visibility into your DigitalOcean infrastructure from one dashboard, live in minutes.