Operations | Monitoring | ITSM | DevOps | Cloud

Latest News

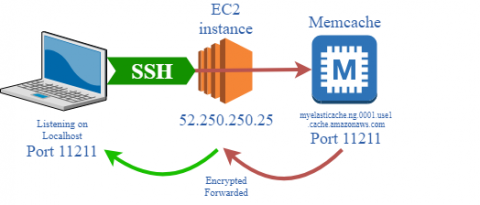
Connect to Memcache ElastiCache through EC2

You can quickly and efficiently use SSH to safely access data in your remote Memcache Elasticache data stores with just a single command. This tip not only enables you to access your remote server as if it was local and take advantage of local tools, but also modify data remotely, download Memcache data, and do it all securely, through an SSH encrypted connection.

Anatomy of a Profitable Side Project: StatusGator 2016 Review

In 2016, my side project StatusGator garnered enough paying customers to be profitable. I have wanted to document and share what I’ve learned along the way for months. But doing so requires confronting the reality that my side project is not the runaway success that I had hoped it would be, but rather a useful tool for myself and for others, that can exist forever thanks to the fact that it ekes out a meager profit on paper.

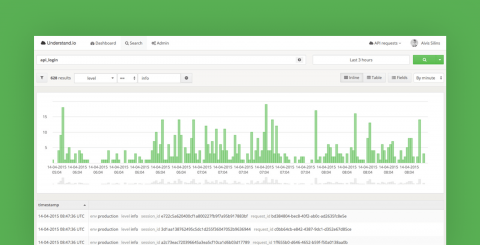
Understand.io – Online Event and Log Management

Applications logs are a critical factor in helping ensure that your online applications are running at their best. By using Understand.io you can get deep visibility into your applications in real-time, helping you to easily track down error messages, application requests, customer problems, and much more.

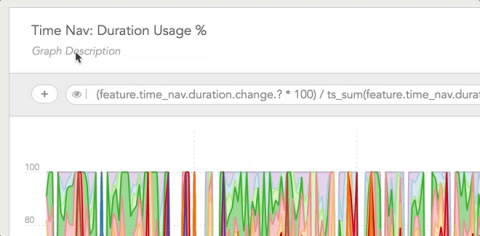
Server & Application Monitoring Pricing Comparison: Instrumental, New Relic, Datadog, Librato, and SignalFx

Confused about the price of an application and server monitoring tool? So were we! Every tool is priced differently and there are a lot of nuances. We’ll walk you through important terminology differences, the pros and cons of different plans, and then discuss the pricing details for Librato, New Relic, SignalFX, Datadog, and of course, Instrumental.

Node.js Application Performance Monitoring

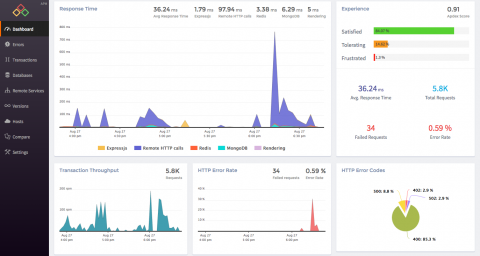
Atatus is a comprehensive application performance management (APM) suite for Node.js applications. Atatus Node.js APM gives you the deeper visibility into the every web transactions happened in your Node.js apps. With Atatus, you can identify the slowest web transactions and see where your web requests are spending time whether it is in the database, remote services or middlewares. Atatus makes Node.js monitoring simpler and easier.