Operations | Monitoring | ITSM | DevOps | Cloud

Latest Posts

Expand your monitoring reach with Datadog's enhanced Azure integration

Microsoft Azure is one of the fastest-growing cloud platforms in the world, offering a wide range of products for deployment, testing, and cloud storage. Datadog is committed to maintaining an extensible monitoring solution for Azure’s growing ecosystem that doesn’t require lots of manual configuration. That’s why we are excited to announce the following enhancements to Datadog’s Azure integration.

Datadog's KubeCon 2020 guide

The CNCF’s KubeCon North America 2020 is the premier event for adopters and technologists to learn about and work with the Kubernetes community—and it’s coming up in just a few days. With so much to do and learn within a short period of time, it can be challenging to know where to focus your time. Now that we’re living in an age of all-virtual conferences, that challenge has only increased.

Manage CloudFront real-time logs in Datadog

Amazon CloudFront is a content delivery network (CDN) that minimizes latency by caching your content on AWS edge locations around the world. With CloudFront real-time logging, you can understand how efficiently CloudFront is distributing your content and responding to requests. You can collect CloudFront real-time logs in Datadog—in addition to CloudFront metrics—to get deep visibility into the health and performance of your CloudFront distribution.

Monitor MarkLogic with Datadog

MarkLogic is a multi-model NoSQL database with support for queries across XML and JSON documents (including geospatial data), binary data, and semantic triples—as well as full-text searches—plus a variety of interfaces and storage layers. Customers include large organizations like Airbus, the BBC, and the U.S. Department of Defense. Because MarkLogic can process terabytes of data across hundreds of clustered nodes, maintaining a deployment is a complex business.

Monitor DNS with Datadog

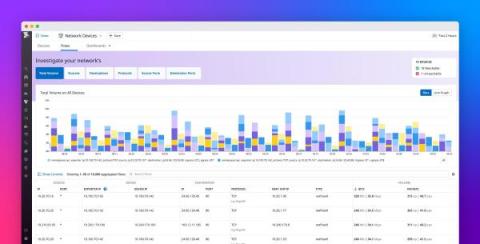
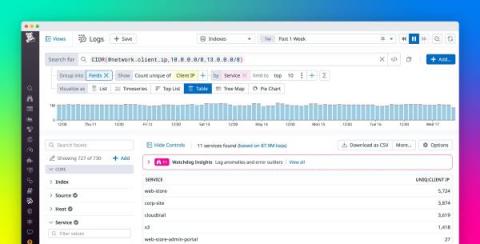
DNS is a critical component of your infrastructure, enabling your services to reach the endpoints they rely on and connecting your users to your web applications from anywhere in the world. In order to keep your DNS healthy and performant, you need complete visibility into both internal and external DNS resolution. Datadog is excited to announce new DNS monitoring features that help you troubleshoot DNS end-to-end, so you can ensure your applications’ performance and availability.

Generate process metrics to analyze historical trends in resource consumption

Your application’s health depends on the performance of its underlying infrastructure. Unexpectedly heavy processes can deprive your services of the resources they need to run reliably and efficiently, and prevent other workloads from executing. If one of your applications is triggering a high CPU or RSS memory utilization alert, the issue has likely occurred before.

Monitor Snowflake with Datadog

Snowflake is a cloud-native data platform that enables users to easily store, manage, analyze, and share high volumes of structured and semi-structured data. Whereas traditional data architectures often consist of multiple databases, data warehouses, and data lakes, Snowflake breaks down the silos between your different data sources and serves as a single source of truth for a wide range of simultaneous workloads.

Expand your Sleuth monitoring reach with Datadog

Sleuth is a deployment tracking tool that gives you a deeper level of insight into your CI/CD workflows by tracking all of your team’s deployment tools from a single dashboard. Sleuth integrates with different components of your deployment pipeline and develops an understanding of your development processes. It can then automatically alert you as to when code is shipping, when manual approvals are needed, and when failures occur.