Operations | Monitoring | ITSM | DevOps | Cloud

Latest Posts

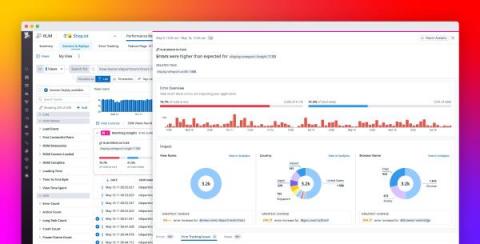
Make sense of application issues with Datadog Error Tracking

When your applications raise errors, you need a way to make sense of them so you can set priorities, start troubleshooting, and gauge the success of your efforts. Errors can appear within the thousands of browser sessions and backend hosts running your software, making it difficult to find meaning within the noise. This is especially true of frontend errors, where seemingly endless permutations of browser version, location, and other environmental details can make it hard to spot trends.

Incorporate Datadog Synthetic tests into your CI/CD pipeline

Testing within the CI/CD pipeline, also known as shift-left testing, is a devops best practice that enables agile teams to continually assess the viability of new features at every stage of the development process. Running tests early and often makes it easier to catch issues before they impact your users, reduce technical debt, and foster efficient, cross-team collaboration.

Improve mobile user experience with Datadog Mobile Real User Monitoring

From gaming and social media to e-commerce and travel, mobile is reshaping the way businesses operate and engage with their customers. In an increasingly competitive market, ensuring your mobile applications stay highly performant and resilient will be critical in differentiating yourself from the crowd as well as avoiding uninstalls and poor app reviews.

Expand your monitoring reach with the Datadog Marketplace

The Datadog Partner Network (DPN) is a rapidly growing registry of hundreds of leaders in the cloud service industry who choose Datadog to meet their infrastructure-monitoring needs. Partners are well-acquainted with the more than 400 technology integrations available to Datadog customers, but with the huge diversity in technical stacks used by our customers, there’s always demand for more customization and flexibility.

Enable preconfigured alerts with Recommended Monitors

Datadog’s more than 400 integrations collect monitoring data from across your entire stack, giving you full visibility into the health and performance of your applications and infrastructure. Alerts are a crucial part of any monitoring workflow, as they draw your attention to problems in your system before they affect your users. But whether you’re migrating to a new environment or integrating a new technology into your stack, it’s not always clear what data you should alert on.

Introducing Datadog Compliance Monitoring

Governance, risk, and compliance (GRC) are major inhibitors for organizations moving to the cloud—and for good reason. Cloud environments are complex, and even a single misconfigured security group can result in a serious data breach. In fact, asset misconfigurations were the leading cause of cloud security breaches in 2019. This puts a lot of pressure on developer and operations teams to properly secure their services and maintain regulatory compliance.

Incident Management with Datadog

When your application experiences an outage, the tools your team uses to manage its response can make all the difference in how quickly they resolve the problem and avoid it in the future. An effective incident management workflow depends on accessible, integrated tools as well as clear, direct channels of communication. And, even after the matter’s been resolved, documentation and analysis of an outage is vital to ensuring it never happens again.

Dash 2020: Guide to Datadog's newest announcements

Today, at Dash 2020, we unveiled new products and features on the Datadog platform that provide engineering teams with even deeper visibility into their distributed applications and infrastructure. With these additions, Datadog further streamlines every step of your release cycle, from shift-left testing in your CI/CD pipelines to profiling your code in production.

Zero instrumentation serverless observability with AWS SAM and CDK integrations

As organizations build out their serverless footprint, they might find themselves managing hundreds or thousands of individual components (e.g., Amazon S3 buckets, Amazon DynamoDB tables, AWS SQS queues) for just a single application. At the same time, performance issues can crop up at any of these points, which means that having access to detailed observability data from your serverless functions is crucial for effective troubleshooting.

Monitor your Windows containers with Datadog

As cloud providers and infrastructure technologies grow their support for Windows containers, developers who use the Windows ecosystem are more and more able to enjoy the benefits of containerization. It’s quicker and easier than ever to modernize and deploy applications that use Windows-specific frameworks like .NET. Plus, Windows developers can use orchestration services like Kubernetes, Amazon ECS, or Docker Swarm to manage the complexity that containerized environments introduce.