Operations | Monitoring | ITSM | DevOps | Cloud

PagerDuty Named a Leader in GigaOm's Inaugural 2023 Incident Response Platforms Radar Evaluation

In a world where organizations of all industries increasingly rely on digital innovation and experiences to create differentiation in the market, it has never been more critical to ensure the integrity of their operations are safeguarded against unforeseen outages and incidents. Operational disruptions today can have a major impact on brand reputation, create negative revenue implications and impact customer loyalty.

Sysdig Achieves the Amazon EKS Ready Designation

Today Sysdig has been recognized for achieving the Amazon Elastic Kubernetes Service (Amazon EKS) Ready designation from Amazon Web Services (AWS). This specialization recognizes that the Sysdig cloud-native application protection platform (CNAPP) is validated by AWS Partner Solutions Architects to integrate with Amazon EKS and Amazon EKS Anywhere. Amazon EKS Ready Partners like Sysdig offer AWS customers the ability to customize the Kubernetes solution to fit their business needs.

How to Monitor MongoDB Metrics with OpenTelemetry

For high throughput systems that focus on gathering continuous data or have a heavy read-only traffic, NoSQL databases came as a blessing. NoSQL databases, due to their unstructured nature of data, allow relatively faster inserts as well as reads compared to relational databases. One such database that’s quite popular today is MongoDB. In this article, our focus would be to understand how to extract metrics out of MongoDB and ship them to Signoz using the Open Telemetry collector.

Memcached Metrics Monitoring with OpenTelemetry

Let's dive deep into the realm of Memcached, where we'll uncover the power of monitoring with OpenTelemetry and SigNoz. This isn't just about caching data; it's about watching over Memcached like a vigilant guardian, ensuring it performs at its best, and optimizing your application's speed. In this tutorial, you will install OpenTelemetry Collector to collect Memcached metrics that should be monitored for performance and then send the collected data to SigNoz for visualization and alerts.

Diving into JTAG - Overview (Part 1)

As the first segment of a three-part series on JTAG, this post will give an overview of JTAG to set up some more in-depth discussions on debugging and JTAG Boundary-Scan. We will dive into the intricacies of the interface, such as the Test Access Port (TAP), key registers, instructions, and JTAG’s finite state machine. Like Interrupt? Subscribe to get our latest posts straight to your inbox.

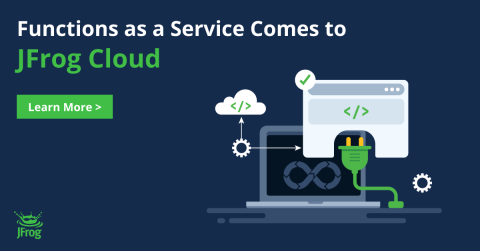
Doing DevOps Your Way On SaaS Solutions: Custom Plugins Come to JFrog Cloud with Workers Service

To no one’s surprise, cloud adoption continues to be a focus for organizations of all sizes and verticals. However, for those who are used to the flexibility and adaptability that comes with customizing self-hosted software, moving to a SaaS offering and losing some of that customization can be a deal breaker. At JFrog, giving developers the freedom – and flexibility – to work however they want to has always been a central tenet to our offering.

The First 48 Hours of Ransomeware Incident Response On-Demand Webinar

The first 48 hours of incidents response is the most critical. We will explain few important steps that need to be taken to mitigate the impact on service availability, information systems integrity and data confidentiality. The cyber resilience is also covered by the individual national regulations and directives. In this on-demand webinar we’ll let's take a closer look at it and explain why principles of Network Detection and Response shall be a crucial part of technical measures implementation for regulated entities.