Operations | Monitoring | ITSM | DevOps | Cloud

Monitor your network traffic anywhere with NetFlow Analyzer's GUI on your iPhone

With the evolution of technology in recent times, the face of communication is ever-changing. In today’s environment, failing to adapt to these changes would mean failing to understand what the customer needs. Since every organization is migrating to smartphones and tablets, and employees are starting to depend more on these mobile devices, we at the NetFlow Analyzer team decided to up our game in terms of our mobile offering.

Two New Color Themes in the Event Viewer Display Options

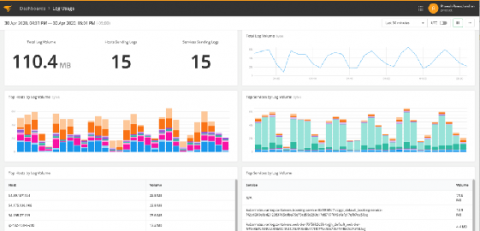
Thousands of teams use SolarWinds® Papertrail™ to manage different types of logs. And with such a large and diverse group of users, there’s a wide variety of needs and preferences. Fortunately, we added a Display Preferences menu to the footer in the new Papertrail event viewer, allowing us to create and deliver new display options and color themes. If you’ve opened the Display Preferences menu this week, you may have noticed two new color themes: Solarized and Solarized Light.

Extend the Power of Your Teams With PagerDuty's ServiceNow Integration Update

You asked and we’re delivering! We’re introducing several new and exciting features to PagerDuty’s ServiceNow integration that you, our customers, have requested. Our most anticipated new feature utilizes ServiceNow CMDB (Configuration Management Database) data to easily build service hierarchies in PagerDuty through business service dependencies.

Introducing a New Splunk Add-On for OT Security

The lines Between IT and OT are blurring. With IT and Operational Technology (OT) systems converging, ensuring the security of devices, applications, physical locations and networks has never been more difficult or more important. There is a growing recognition by security professionals that they have a readiness and visibility problem in plain sight.

Announcing Shared Scenarios to Promote a Culture of Reliability

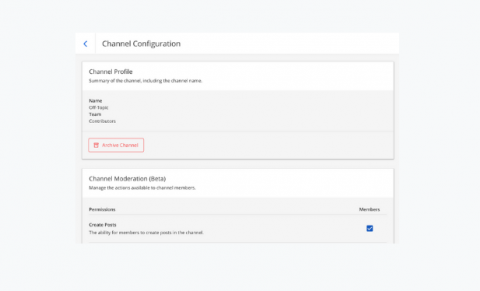
Get started with Gremlin’s Chaos Engineering tools to safely, securely, and simply inject failure into your systems to find weaknesses before they cause customer-facing issues. Today, Gremlin is excited to announce the ability to share a Scenario across your entire organization. This allows you to build up a library of reliability exercises that are customized to your company’s applications and technology.

Elastic 7.9 released, with free distribution tier of features of Workplace Search and endpoint security

We are pleased to announce the general availability of Elastic 7.9. This release brings a broad set of new capabilities to our Elastic Enterprise Search, Observability, and Security solutions, which are built on the Elastic Stack — Elasticsearch, Kibana, Logstash, and Beats.

What's new in Kubernetes 1.19?

Kubernetes as a project is maturing, support has been increased from nine to 12 months, and there’s a new protocol in place to ensure a steady progress on feature development. Also, many of its new features are meant to improve the quality of life of its users, like Generic ephemeral inline volumes, or the structured logging.

Explore Kubernetes resources with Datadog Live Containers

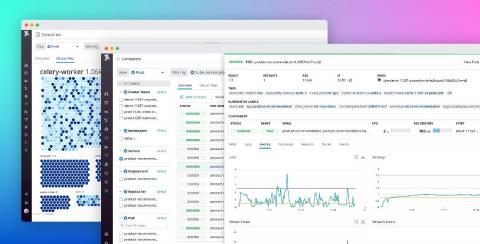
Running Kubernetes applications requires visibility into not only the overall performance of clusters but also the health of individual pods, deployments, and other resources that make up your environment. Datadog already integrates with your containerized environments and includes features like the Live Container view and the Container Map, enabling you to easily monitor Kubernetes and container runtime performance in real time and get deep visibility into clusters.