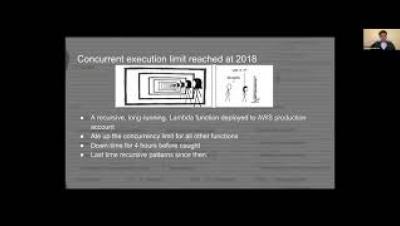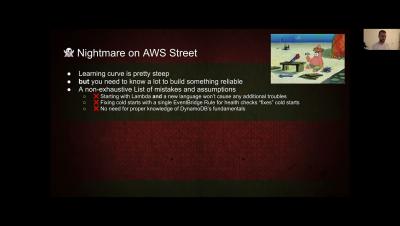
AWS bills from hell: how to avoid surprise cloud bills and optimize cloud costs
How Dashbird.io accidentally racked up a cloud bill from hell and common mistakes to avoid and smart tricks to use in order to keep your cloud cost at bay.


The latest News and Information on Monitoring for Websites, Applications, APIs, Infrastructure, and other technologies.
Here at Grafana Labs, when we’re building integrations for Grafana Cloud, we’re often thinking about how to help users get started on their observability journeys. We like to focus some of our attention on the different technologies you might come across along the way. That way, we can share our tips on the best ways to interact with them while you’re using Grafana products.
In this tutorial, we will go through a working example of a Python application auto-instrumented with OpenTelemetry. To keep things simple, we will create a basic “Hello World” application using Flask, instrument it with OpenTelemetry’s Python client library to generate trace data and send it to an OpenTelemetry Collector. The Collector will then export the trace data to an external distributed tracing analytics tool of our choice.
The Docker images we provide for both Icinga 2 and Icinga Web 2 already contain quite a number of modules. For example, the Icinga Web 2 image contains all the Web modules developed by us. But one of the main benefits of Icinga is extensibility, so you might want to use more than what is already included. This might be some third-party module or a custom in-house module.