
Operations | Monitoring | ITSM | DevOps | Cloud

Kepler: Coordinate Every AI Coding Agent From One Place

Kepler is GitKraken's new agentic development environment (ADE), and it's now in public preview for Windows, Mac, and Linux. If GitKraken Desktop is built to go deep on one repository, Kepler is built to go wide: one task, multiple repositories, multiple AI agents, tracked in a single place instead of a dozen open terminals.
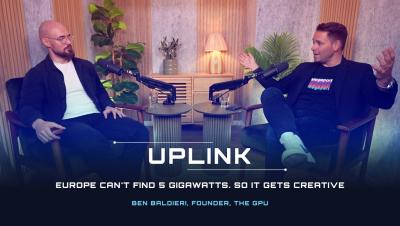
Europe Can't Find 5 Gigawatts. So It Gets Creative | Ben Baldieri, Founder of The GPU

Everyone is talking about multi-gigawatt AI data centers. Europe is solving a different challenge. In this episode of Uplink, Michael Reid sits down with Ben Baldieri, Founder of The GPU, to explore how power constraints, fragmented regulation, and limited grid capacity are reshaping Europe's AI infrastructure landscape.

Virtana's Agentic AI

Anomaly Detection Isn’t Agentic AI. Detecting anomalies is table stakes. That’s pattern recognition. Agentic AI is different. It understands dependency chains, explains cause and recommends action. There’s a big gap between: “Something changed.” and “Here’s what broke and what to do next.” If your AI stops at anomaly scoring, you’re still doing the thinking.

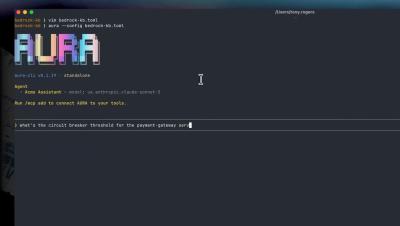
Run an AI SRE Agent Entirely Inside AWS with Bedrock and S3: AURA

An on-call question returns the threshold and the escalation owner from your own runbooks, and the answer comes back without a call to anyone outside. AURA runs against Bedrock as its model provider, using Claude Sonnet 5 served by AWS in the same region. Authentication is the normal AWS credential chain: a profile on a laptop, an IAM role in EKS.

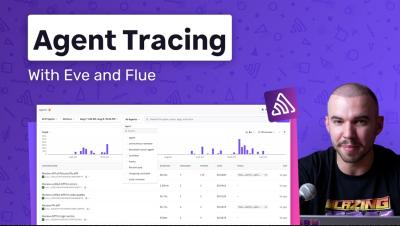
Debug AI agents wherever they run, from Slack bots to code review with Sentry's Agent Tracing

Agent Tracing shows the full execution path of an AI agent: the model call, every tool invocation and its arguments, token counts, cost, and the span where it broke. Same traces and spans you already use, with agent-specific attributes on top. Serge walks through three apps — a Next.js e-commerce agent using the AI SDK with a failing tool call, a Slack bot built with Eve that orders lunch, and a code review agent built with Flue over MCP.

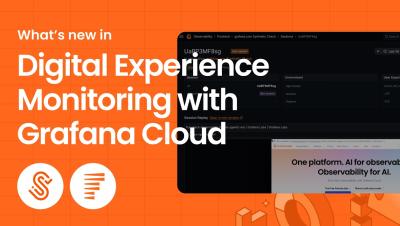
What's New in Digital Experience Monitoring with Grafana Cloud

Grafana Digital Experience Monitoring (DEM) brings Frontend Observability and Synthetic Monitoring together, so teams can go from symptom to root cause without bouncing between tools. In this video, Bukola, Senior Developer Advocate at Grafana Labs, demos two of the newest DEM features. Session Replay and the integration between Synthetic Monitoring and Frontend Observability.

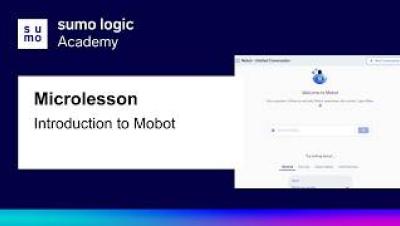
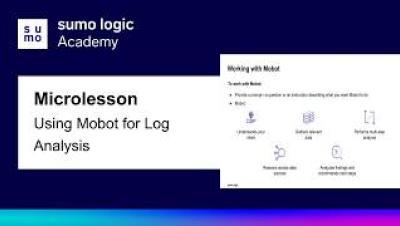
Microlesson: Using Mobot for Log Analysis

This video demonstrates how to use Mobot to investigate issues, interpret its findings, and identify recommended next steps. Follow along as Mobot responds to a prompt by understanding your intent, gathering relevant data, performing multi-step analysis, reasoning across data sources, surfacing insights, and recommending next steps.