Operations | Monitoring | ITSM | DevOps | Cloud

The latest News and Information on Application Performance Monitoring and related technologies.

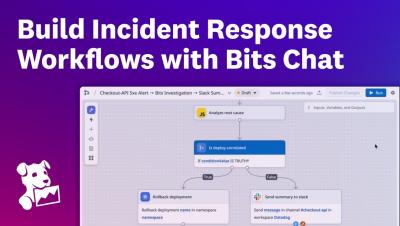
Build incident response workflows with Datadog Bits Chat

See how Bits Chat turns a natural-language request into an automated incident response workflow. In this demo, Bits Chat builds a workflow that investigates a monitor alert, identifies whether a recent deployment caused the issue, rolls it back when appropriate, and sends a summary to Slack.
Sponsored Post

Raygun APM Agent 3.0.14: faster, simpler, and ready for ARM64

Today we are releasing Raygun APM Agent 3.0.14 for Windows, Linux, and Azure App Service. This release is the result of a substantial modernization of the Agent, profiler, installers, and release pipeline. It makes Raygun APM easier to deploy, reduces overhead in several critical paths, adds native Linux ARM64 support, and lets developers investigate APM data through Raygun API v3 and the Raygun MCP server. If you are upgrading from version 2.3.0, there is much more here than a version-number change.

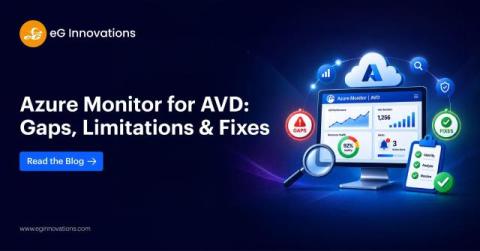
Azure Monitor for AVD: Gaps, Limitations & Fixes

Microsoft Azure Monitor is an essential platform service for monitoring Azure resources. It provides valuable telemetry, logs, metrics, and alerts that help administrators understand the health of their cloud infrastructure. For organizations running Azure Virtual Desktop (AVD), Azure Monitor is usually the first monitoring service they deploy.

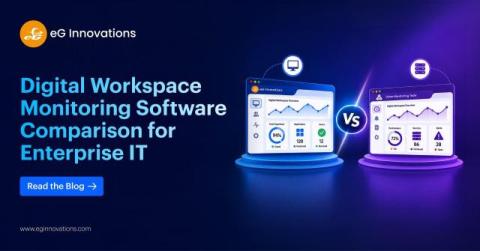
Digital Workspace Monitoring Software Comparison for Enterprise IT

As enterprises adopt hybrid work, IT teams face growing challenges in keeping the digital workspace fast and reliable. Employees access business applications through virtual desktops, SaaS platforms, cloud infrastructure, and physical endpoints, all of which contribute to the overall user experience. Monitoring these environments using disconnected native tools often leaves critical visibility gaps. Digital Workspace Monitoring closes those gaps.

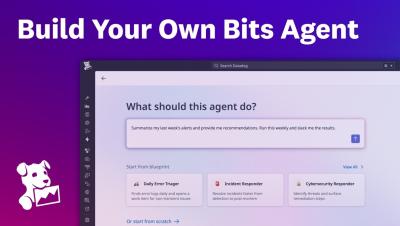
Build your own Bits Agent with Datadog Bits Agent Builder

Datadog Bits Agent Builder lets you build AI agents that use your observability data to automate operational tasks. In this walkthrough, see how to build an agent that analyzes monitor and alert activity, identifies patterns, and provides actionable recommendations to improve your monitoring strategy. With Bits Agent Builder, you can give agents access to Datadog data and tools, customize their instructions and models, and run them automatically to continuously analyze and act on your environment.

Gremlin app for Dynatrace - DEMO!

Dynatrace gives engineering teams deep, real-time visibility into every service they run. That visibility is the foundation of every effective reliability practice, and it's exactly the foundation Gremlin is built to extend. Once you can see how your distributed systems behave today, the next step is knowing how they'll behave under failure tomorrow—and to do it before those failures happen.

How to add Software Catalog metadata at scale with Terraform | Datadog Tips & Tricks

Adding metadata to Software Catalog entities manually is a tedious process that doesn’t scale as your service count grows. This video shows you how to automate that work with Terraform so you can add shared metadata across existing Software Catalog entities at scale.

GitHub Copilot Monitoring & Observability with OpenTelemetry

Learn how to implement end to end monitoring and observability for GitHub Copilot Chat using OpenTelemetry and SigNoz. In this video, we walk through enabling the OpenTelemetry exporter built into the Copilot Chat extension in VS Code, collecting a trace for every agent turn, and visualizing everything in SigNoz to gain real time visibility into model calls, tool executions, token usage, prompt cache savings, latency, and failures. Copilot Chat ships its own OTLP exporter, so there is no instrumentation library to install and no collector to run.

Grok Build Observability with OpenTelemetry

Learn how to implement end to end observability and monitoring for Grok Build, xAI's terminal coding agent, using OpenTelemetry and SigNoz. In this video, we walk through turning on Grok Build's native OpenTelemetry exporter, collecting metrics and structured session events, and visualizing everything in SigNoz to gain real time visibility into token usage, sessions and turns, tool calls and their outcomes, error categories, and startup latency. Grok Build ships its own exporter, so instrumenting it is a matter of configuration, with no library to install and no collector to run.

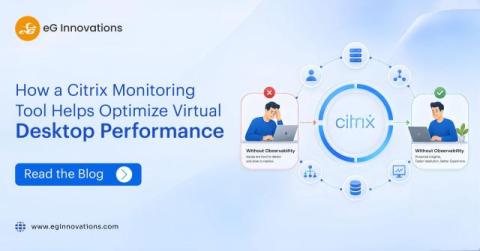
How a Citrix Monitoring Tool Helps Optimize Virtual Desktop Performance

A trader waits 50 seconds for a Citrix session to load while the market moves. A clinician steps away from a patient because the virtual desktop froze mid-record. A call-center agent watches keystrokes lag every customer question. None of these people file a detailed bug report. They contact the helpdesk, reporting that “Citrix is slow,” and lose minutes of productive time, multiplied across thousands of users every day.