The advent of Machine Learning (ML) has unlocked new possibilities in various domains, including full lifecycle Application Performance Monitoring (APM). Maintaining peak performance and seamless user experiences poses significant challenges with the diversity of modern applications. So where and how does ML and APM fit together? Traditional monitoring methods are often reactive, resolving concerns after the process already affected the application’s performance.
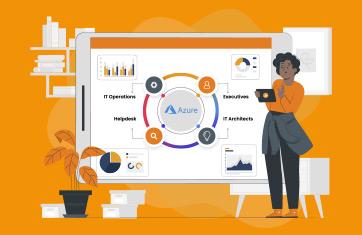
AVD (Azure Virtual Desktop) has grown in popularity and for many reasons many organizations are choosing to consume AVD via a specialist Managed Service Provider (MSP). For the MSPs offering AVD, monitoring and troubleshooting AVD especially for multi-tenant environments is challenging and involves significant, costly and skilled effort using native tools such as Azure Insights or Azure Monitor.
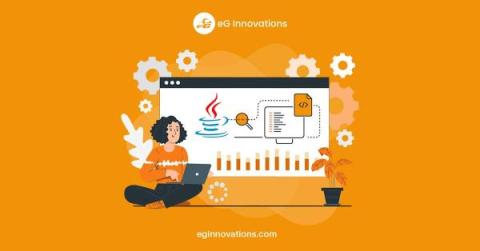
Many server-side applications are written in Java and often process tens of millions of requests per day. Key applications in various domains like finance, healthcare, insurance and education are often Java-based. When these applications slow down or fail, they affect the user experience and in turn, reduce business revenue. Behind many web forms or form-like GUIs there will often be a Java application.
A guest blog from Donny van der Linde, Pre-Sales Consultant at eG Innovations’ partner Liquit covering how to leverage eG Enterprise’s monitoring in combination with Liquit Workspace technologies to build powerful proactive contextual access workflows to support automated application delivery. An example using eG Enterprise’s user experience metrics to trigger remediation via Liquit Smart Icons is given.
Today, I’ll be covering troubleshooting Azure Virtual Desktop (AVD) issues. I’ll cover the common causes of problems beyond logon and how you can monitor and troubleshoot to identify the root-causes of issues and how to resolve them resolve them. For information on troubleshooting logon problems and slow logons, please see my previous article: Troubleshoot Slow Azure Virtual Desktop (AVD) Logons.
In a world where Software as a Service (SaaS) products are integral to daily life, maintaining uninterrupted service for end-users is paramount. However, stuff happens. When it does, our most valuable response (other than restoring service ASAP) is to review the series of events that led up to the incident and learn from them. On August 25th, 2023, at 7:02 AM NZT, Raygun experienced a significant incident that impacted our API ingestion cluster, leading to an outage lasting approximately 1 hour and 15 minutes. While this wasn't fun for anyone involved, this incident did prove to be a valuable learning experience, shedding light on the importance of infrastructure management and resilience.
Here in the Benelux region, we have recently been seeing increased interest in our capabilities to monitor and automate root-cause diagnostics for VMware Tanzu and other containerized / K8s technologies. Tanzu monitoring is one of the VMware technologies we’ll be demoing at VMware Explore in Barcelona (6 – 9 November 2023) and expect to see a lot of interest in it.
Application Performance Monitoring (APM), tracing, and observability are fundamental software development and system management approaches. Each of these three concepts uniquely ensures that your applications operate, efficiently, smoothly, and reliably. Your organisation will more than likely already adopt one of these approaches, or even two, potentially all three.