How Loki Helped Paytm Insider Save 75% of Logging and Monitoring Costs
Paytm Insider’s motto is “to make every day less everyday,” says Hitesh Pachpor, Technical Manager for the popular platform for buying event tickets in India.

Paytm Insider’s motto is “to make every day less everyday,” says Hitesh Pachpor, Technical Manager for the popular platform for buying event tickets in India.
Kibana is a powerful visualization platform designed specifically for log management with Elasticsearch. It already provides a lot built-in, but its open-source nature obviously lends it to some pretty cool simple and complicated additions from its community of devs. Some favorites include adding certain kinds of visualizations, API attachments, better integration between Kibana and other platforms, as well simple add-ons for flair in reports.
In my role at Grafana Labs, I speak with a lot of engineers who feel the pain of their organizations’ lack of consolidated observability – so much so they set out to solve the problem themselves. Often, that search leads to Grafana, and after a quick exploration of what an enterprise feature or cloud solution can provide, they’ll get in touch. We work with them on data collection and help them start a trial.
PromCon was held in Munich again this year, and this year was the best. I had a great time meeting lots of old friends and interacting with the amazing Prometheus community. I want to give a big shout out to Richi H for organizing the conference, and to everyone who attended for being an amazing audience! This year Grafana Labs carbon offset travel and food for the conference – but this post is not about that. Grafanistas gave 4 talks in the main track and another 6 lightning talks.
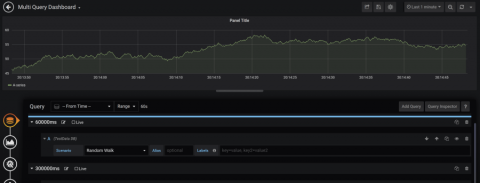
Building dashboards that show real-time streaming data and allow for interactive queries is challenging. At the recent InfluxDays conference in San Francisco, Ryan McKinley, Grafana Labs VP of Applications, discussed new approaches to integrate real-time data into Grafana dashboards. Prior to joining Grafana, McKinley worked at a renewable energy startup, Natel Energy, which builds hydropower turbines. There, he used Grafana and Influx to display an overview of how the systems were working.
Metrictank exposes many metrics to aid with operating the software in production. As the metrictank team (the primary on-call team for metrictank at Grafana Labs) grows and onboards new people, and more customers deploy the software on their premises, we need to solve a few problems regarding the metrics exposed by metrictank.
You might have seen a few of my tutorial videos on Grafana and Grafana Loki. If not, check them out here. These videos are a bit of an experiment to showcase the awesome work being done by the Grafana OSS community and for me to understand the technology better. I got a lot of encouraging feedback on the videos, so I plan to continue making them. A few folks also wanted to know why and how I created them. Happy to share the details here with you, and I look forward to your Grafana videos :)