Operations | Monitoring | ITSM | DevOps | Cloud

The latest News and Information on Containers, Kubernetes, Docker and related technologies.

How to monitor OPA Gatekeeper with Prometheus metrics

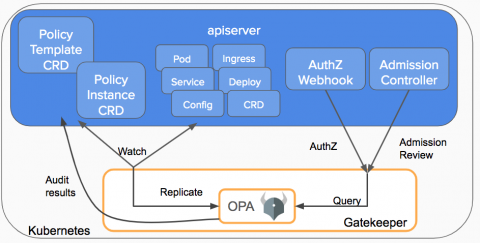
In this blog post, we’re going to explain how to monitor Open Policy Agent (OPA) Gatekeeper with Prometheus metrics. If you have deployed OPA Gatekeeper, monitoring this admission controller is as relevant as monitoring the rest of the Kubernetes control plane components, like APIserver, kubelet or controller-manager. If something breaks here, Kubernetes won’t deploy new pods in your cluster; and if it’s slow, your cluster scale performance will degrade.

How tech teams are making extraordinary progress in COVID-19 shutdown while working remotely?

COVID-19 has led businesses into extreme work challenges. To overcome these challenges, companies have shifted their working patterns and have embraced Remote Work to avoid any negative impact on employee’s health as well as the business. COVID-19 has made IT-sector office culture’s shift to remote work prominently. The tech teams, who already have DevOps processes in place, got huge benefits and did not get much impact while shifting their workplace from regular office to home.

Scaling OpenShift Container Resources using Ansible

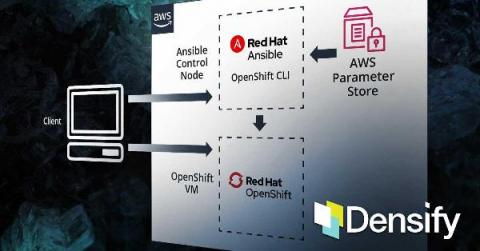
Assume you have a process to determine the optimal settings for CPU and memory for each container running in your environment. Since we know resource demand is continuously changing, let’s also assume these settings are being produced periodically by this process. How can you configure Ansible to implement these settings each time you run the associated playbook for the container in question?

Protecting Critical Infrastructure in Kubernetes and Rancher

“As we expand, it’s critical for our team to have both a fast and automated rollout process for each customer environment. In the end, each of our user’s access experience must be identical. Rancher is one product that’s critical to that strategy.” – Jeff Klink, VP Engineering, Cloud and Security Specialist, Sera4 Security worries keep many of us awake at night – no matter our industry.

Custom Alerts Using Prometheus in Rancher

This article is a follow up to Custom Alerts Using Prometheus Queries. In this post, we will also demo installing Prometheus and configuring Alertmanager to send emails when alerts are fired, but in a much simpler way – using Rancher all the way through. We’ll see how easy it is to accomplish this without the dependencies used in previous article.

You've launched your first Kubernetes cluster, now what?

As Kubernetes continues to grow in popularity at a staggering rate, it’s only natural more and more people want to see what all the fuss is about. We’ve seen first hand how excited people are to try it out since launching #KUBE100 (our Kubernetes beta) – we’ve had tremendous interest and some great feedback so far. If you’re reading this and you have no idea what #KUBE100 is, it’s the name we gave to our k3s-powered, managed Kubernetes beta program.

Monitoring Amazon EKS logs and metrics with the Elastic Stack

To achieve unified observability, we need to gather all of the logs, metrics, and application traces from an environment. Storing them in a single datastore drastically increases our visibility, allowing us to monitor other distributed environments as well. In this blog, we will walk through one way to set up observability of your Kubernetes environment using the Elastic Stack — giving your team insight into the metrics and performance of your deployment.