Operations | Monitoring | ITSM | DevOps | Cloud

December 2024

Grafana LLM plugin updates: choose the LLM models and providers that work best for you

At Grafana Labs, our mission has always been to empower users with the tools they need to build their own observability solutions. Our big tent philosophy embodies this mission by allowing you to choose the tools and technologies that best suit your needs. In this post, we want to share an update to our LLM plugin that reflects this philosophy in action.

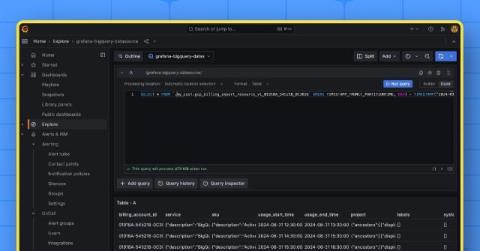
How to securely connect Grafana to Google BigQuery using Workload Identity Federation

Umesh Pawar is a Senior Cloud Engineer at Searce, and is also the co-organizer of the Grafana and Friends Delhi Group. Umesh has been focused on infrastructure and app modernization, as well as observability solutions including the Grafana LGTM Stack, for the past two years. With the Google BigQuery data source plugin for Grafana, you can easily query and visualize data from BigQuery directly in Grafana.

How to Maximize Customer Retention with Grafana Cloud SLOs | Demo | Alert Management | Incidents

In this video, Mark Covelo, a Solutions Engineer at Grafana Labs, demonstrates how Grafana Cloud SLO empowers organizations to improve customer retention by simplifying the adoption of Service Level Objectives (SLOs). SLOs provide critical insights into the customer experience, enabling teams to prioritize and resolve user-impacting issues effectively.

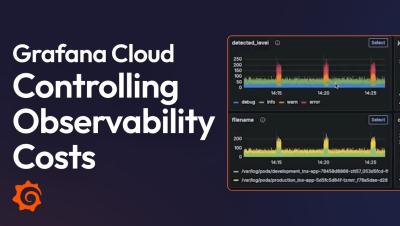
How to Control Observability Costs with Grafana Cloud | Demo | Adaptive Telemetry | Loki | Profiling

In this video, Grafana Labs demonstrates how Grafana Cloud addresses the challenges of rising observability costs faced by organizations worldwide. As observability costs grow and logging architectures become increasingly resource-intensive, teams are forced to make difficult decisions about coverage, often leaving critical blind spots. Grafana Cloud offers a cost-effective, end-to-end observability solution that eliminates the need for compromise on efficiency or performance.

2025 observability predictions and trends from Grafana Labs

From AI to eBPF, 2024 reshaped the observability landscape. As we peer into 2025, Grafana Labs’ experts predict another year of innovation that will redefine how teams understand and optimize their systems, from profiling to platform engineering. Their insights align with what the community is saying, according to early responses from our third annual Observability Survey. Do you agree or disagree with the trends our team believes will transform the world of observability next year?

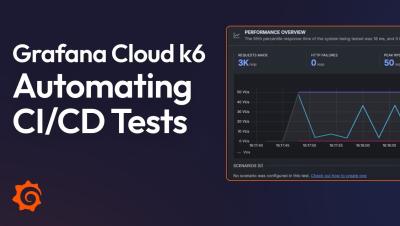
How to Automate CI/CD Tests with Grafana Cloud k6 | Demo | Performance Testing | GitHub Actions

Performance Testing with Grafana Cloud k6: Seamlessly Integrated into CI/CD Pipelines In this video, Grafana Solutions Engineer Sean Carolyn demonstrates how Grafana k6 integrates with CI/CD pipelines to make performance testing an effortless part of the development workflow.

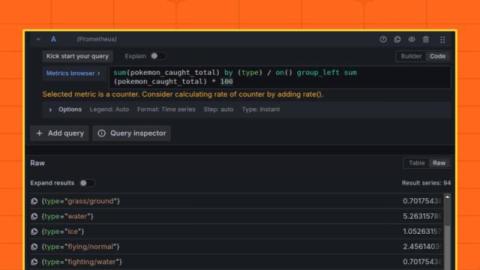
PromQL vector matching: what it is and how it affects your Prometheus queries

Dawid Dębowski is a software engineer at G2A.COM and a Grafana Champion. Holding an MS of Computer Science, Dawid’s main fields of interest related to observability are PromQL and data visualizations using Grafana. Have you ever created an awesome query in PromQL, expecting it to return the exact results you’re looking for, only to receive the “No data” response when you run it? If so, you might have fallen into the trap of PromQL vector matching.

Grafana Labs: Top 10 moments of 2024

2024 was a year of making connections. The open source community gathered in person for GrafanaCON for the first time in five years — meeting in Amsterdam to celebrate Grafana 11, Loki 3.0, a new open source project (cue Grafana Alloy), and more. TailCtrl, an early-stage company that specializes in adaptive trace sampling, joined Grafana Labs to advance our Adaptive Telemetry story (welcome, founder Sean Porter!).

Open source at Grafana Labs: 2024 year in review

Open source has always been the bedrock for everything we build here at Grafana Labs, going all the way back to Grafana creator Torkel Ödegaard’s first commit in December 2013. Ten years after Grafana Labs was founded, open source continued to be our driving force as we worked to develop and evolve our core OSS tools and technologies in 2024.

Grafana Cloud in 2024: Year in review

Throughout 2024, we made a ton of updates to Grafana Cloud, our fully managed, cloud-hosted observability platform powered by the Grafana LGTM (Loki for logs, Grafana for visualization, Tempo for traces, Mimir for metrics) Stack. And, looking back, most of those updates were made with the same three goals in mind: to make Grafana Cloud more efficient, more intelligent, and easier to use, including for those just starting out on their observability journey.

Grafana Loki Query Best Practices with LogQL (Loki Community Call December 2024)

In this December's Loki Community Call, Cyril Tovena, Senior Principal Engineer and LogQL guru walks us through a Grafana Loki query tutorial with LogQL, the Log Query Language used for Loki. He talks about the key "Dos and Don'ts" of LogQL, offering practical tips to help you write better queries, boost performance, and sidestep common mistakes. Whether you’re tuning up your current setup or just diving into LogQL, Cyril’s got you covered.

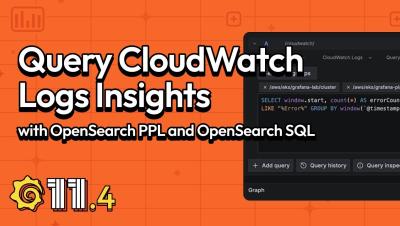
Grafana 11.4 | Support for OpenSearch PPL and SQL queries in the AWS CloudWatch Data Source Plugin

In this video, Ida, a software engineer from the AWS Data Sources squad, introduces an exciting feature in the CloudWatch data source plugin. With Opensearch SQL and Opensearch PPL now supported, you can leverage familiar query languages to explore and visualize your AWS CloudWatch data alongside the existing Logs Insights query language. Learn how to: Availability.

Grafana 11.4 release: Introducing support for OpenSearch PPL and OpenSearch SQL in the AWS CloudWatch data source plugin

Holidays came early for AWS users: Grafana 11.4 introduces support for two new query languages in the AWS CloudWatch data source plugin. Grafana 11.4: Download now Announced during AWS re:Invent, AWS CloudWatch Logs expanded its querying capabilities with the addition of OpenSearch Piped Processing Language (PPL) and OpenSearch SQL. In Grafana 11.4, the AWS Cloudwatch data source plugin has been updated to offer the same functionality — and the same flexibility.

Grafana Alerting: Save time and effort with Grafana-managed recording rules

Grafana Alerting has seen steady growth and adoption since it was revamped in Grafana 9. Since then, we’ve been busy making your alerts more robust, more reliable, and easier to manage. As part of that process, Grafana Alerting has adopted several concepts from Prometheus. The Prometheus alerting model is well understood and flexible, and with Grafana Alerting we want to bring that same flexibility to all Grafana data sources.

Actian & Grafana Cloud: The Search for a Customizable Observability Tool | ObservabilityCON 2023

Over the past few years, Actian has shifted from offering a solely on-premises data integration, management, and analytics product to supporting hybrid and multi-cloud environments as well. To keep up, the team needed a customisable observability tool, and found it in Grafana Cloud. Lead Cloud Operations Engineer Suleyman Kutlu will share his team’s journey, starting with metrics and logs, and venturing into load testing, frontend observability, IRM, and more.

Grafana Labs Customers: What We've Learned Building Observability at Massive Scale

An in-depth conversation with a panel of observability leaders from Sky, Just Eat Takeaway.com, and BlackRock. The panelists share stories about their organizations’ observability journeys, their perspectives on scaling observability across an enterprise, and their opinions on the current trends in the space.

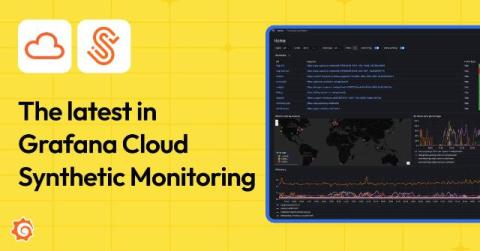
The evolution of Grafana Cloud Synthetic Monitoring: new features, pricing updates, and more

With 2024 coming to a close, it’s a good time to reflect on how Grafana Cloud has evolved this year — and synthetic monitoring, in particular, is one area where we’ve really focused our efforts. In May, we rolled out a revamped version of Grafana Cloud Synthetic Monitoring with the overall goal of making your monitoring processes not just more efficient, but more impactful.

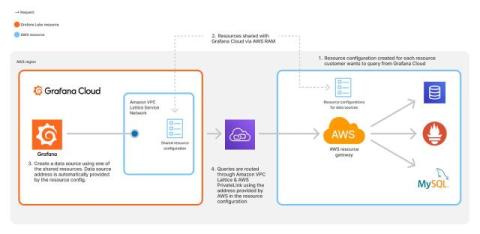
How to query private network data without an agent using AWS and Grafana Cloud

Connecting to data sources in a private network or an Amazon Virtual Private Cloud (Amazon VPC) can require extra attention to the network security configuration to prevent unintended network exposure. For example, if you wanted to query a network-secured data source, like a MySQL database or an Elasticsearch cluster, that is hosted in an on-premises private network, you would need to open your network to inbound queries from a range of IP addresses.