Operations | Monitoring | ITSM | DevOps | Cloud

May 2021

How to alert on high cardinality data with Grafana Loki

Amnon is a Software Engineer at ScyllaDB. Amnon has 15 years of experience in software development of large-scale systems. Previously he worked at Convergin, which was acquired by Oracle. Amnon holds a BA and MSc in Computer Science from the Technion-Machon Technologi Le' Israel and an MBA from Tel Aviv University. Many products that report internal metrics live in the gap between reporting too little and reporting too much.

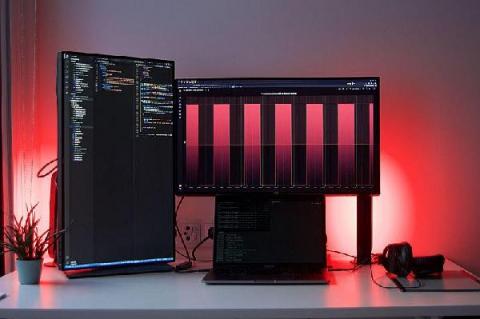
Turn your home office into a NOC room with Philips Hue and Grafana

I recently got a couple of Philips Hue Play lights to spice up my home office setup, and after a bit of tinkering with the APIs, I decided it would be a fun project to create my own personal NOC room, using them to visualize the status of some system I’m monitoring.

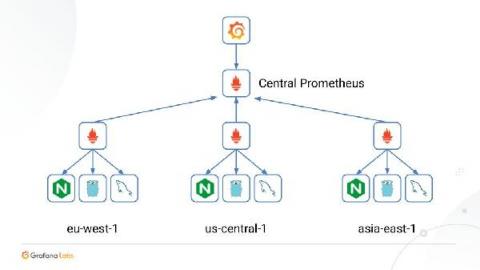
The future of Prometheus remote write

At PromCon last month, Tom Wilkie, Grafana Labs VP of Product, described the origin and purpose of Prometheus remote write and previewed exciting developments on the road map. “We covered our efforts to standardize remote write, document how it works and why it works that way, and then test implementations,” Wilkie said. “In the next release or two of Prometheus, we’ll improve how we send metadata via remote write and start sending exemplars.

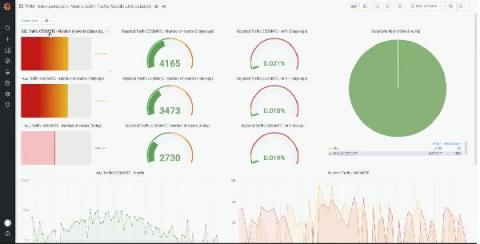
How one mobile company is using Grafana Enterprise for billing system observability and beyond

Calling or texting with a mobile phone may seem like a simple process, but behind the scenes, network providers are engaged in a constant exchange of transactions to pay each other for connecting their customers. If telecom companies don’t stay on top of the data and billing, they could be surprised with their own big bills at the end of each month. Cosmote, the largest mobile network in Greece, handles the challenge by using Grafana Enterprise.

New plugins connect almost all of Redis for monitoring and visualization in Grafana

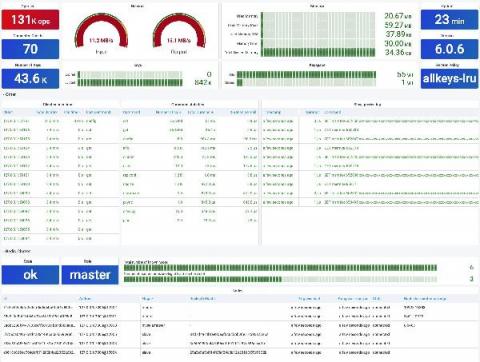
Mikhail Volkov is building observability and monitoring solutions at Volkov Labs and leading Redis plugins for Grafana. Since the Redis project first got underway in 2009, the open source in-memory data store has been embraced by thousands of companies of all types and sizes. According to Stackshare.io, well over 5,000 companies use Redis, including Uber, Airbnb, Twitter, Instagram, and Slack.

What's new in the updated Strava plugin for Grafana

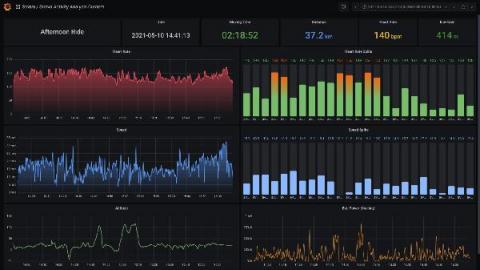
Grafana dashboards are often used to monitor a company’s metrics, but what about using them to monitor yourself? That was the thinking behind our creation of the Strava plugin back in early 2020. Strava is a service that allows athletes to track and analyze their workouts and training sessions. It’s widely used for activities such as running and cycling.

Easily monitor and alert on your Kubernetes clusters with the new Grafana Cloud integration

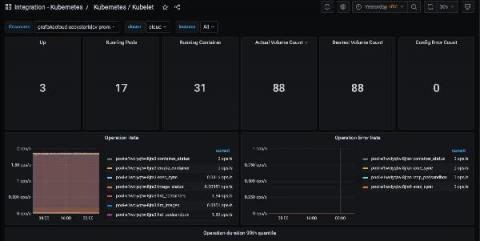
Today we’re excited to introduce the Kubernetes integration for Grafana Cloud, our composable observability platform bringing together metrics, logs, and traces with Grafana. Grafana Cloud users can now easily monitor and alert on core Kubernetes cluster metrics using the Grafana Agent, our lightweight observability data collector optimized for sending metric, log, and trace data to Grafana Cloud.

Monitor your production line with the new Grafana Enterprise data source plugin for SAP HANA

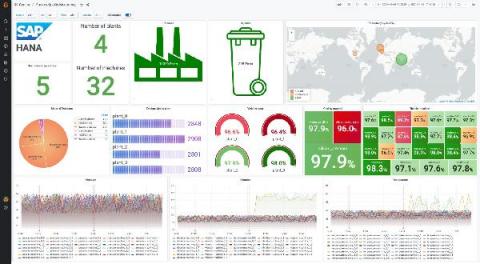
Greetings! This is Abdelkrim from the Solutions Engineering team, and I am with Sriram from the Enterprise Plugin team. We both joined Grafana Labs in February this year, and we already have some stories to share with you. I came to Grafana Labs from a big data and analytics background, and I witnessed a lot of companies storing monitoring and performance data in all kinds of analytics platforms (data lakes, data warehouses, cloud, etc.).

How to correlate Graphite metrics and Loki logs

Grafana Explore makes correlating metrics and logs easy. Prometheus queries are automatically transformed into Loki queries . And we will be extending this feature in Grafana 8.0 to support smooth logs correlation not only from Prometheus, but also from Graphite metrics. Prometheus and Loki have almost the same query syntax, so transforming between them is very natural. However, Graphite syntax for queries is different, and in order to map it to Loki, some extra setup is required.

How shuffle sharding in Cortex leads to better scalability and more isolation for Prometheus

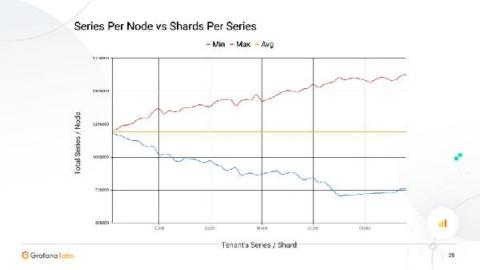
For many years, it has been possible to scale Cortex clusters to hundreds of replicas. The relatively simple Dynamo-style replication relies on quorum consistency for reads and writes. But as such, more than a single replica failure can lead to an outage for all tenants. Shuffle sharding solves that issue by automatically picking a random “replica set” for each tenant, allowing you to isolate tenants and reduce the chance of an outage.

The Grafana Enterprise Stack in less than 3 minutes

Grafana Labs is the open & composable observability company. In just over 6 years, our namesake product, Grafana, has become the world's #1 dashboarding service for time series data with over 6 million users. And we've been recognized as a leader in the space. Grafana Labs has built the world's first open & composable observability stack -- and it's natively designed for monitoring hybrid-cloud, container, and microservices environments.

How to search logs in Loki without worrying about the case

Whether it’s during an incident to find the root cause of the problem or during development to troubleshoot what your code is doing, at some point you’ll have an issue that requires you to search for the proverbial needle in your haystack of logs. Loki’s main use case is to search logs within your system. The best way to do this is to use LogQL’s line filters. However, most operators are case sensitive.

Get started with distributed tracing and Grafana Tempo using foobar, a demo written in Python

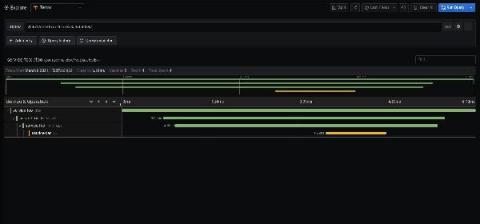
Daniel is a Site Reliability Engineer at k6.io. He’s especially interested in observability, distributed systems, and open source. During his free time, he helps maintain Grafana Tempo, an easy-to-use, high-scale distributed tracing backend. Distributed tracing is a way to track the path of requests through the application. It’s especially useful when you’re working on a microservice architecture.