Integrating Attack Behavior Intelligence into Logstash Plugins
Are you new to Elastic SIEM? Join us for a demo and learn how to start investigating threats in your environment.


We’re excited to share more details today about a long-running project that the Kibana team has been working on for the past couple of years: the Kibana development platform.
At Elastic, we believe in the power of open source and understand the importance of community. By putting the community first, we ensure that we create the best possible product for our users. With Elastic Security, two of our core objectives are to stop threats at scale and arm every analyst. Today, we’re opening up a new GitHub repository, elastic/detection-rules, to work alongside the security community, stopping threats at a greater scale.
At Elastic we are constantly innovating and releasing new features. As we release new features we are also working to make sure that they are tested, solid, and reliable — and sometimes we do find bugs or other issues. While testing a new feature we discovered a Linux kernel bug affecting SSD disks on certain Linux kernels. In this blog article we cover the story around the investigation and how it involved a great collaboration with two close partners, Google Cloud and Canonical.
The Australian Cyber Security Centre (ACSC) recently published an advisory outlining tactics, techniques and procedures (TTPs) used against multiple Australian businesses in a recent campaign by a state-based actor. The campaign — dubbed ‘copy-paste compromises’ because of its heavy use of open source proof of concept exploits — was first reported on the 18th of June 2020, receiving national attention in Australia.
We're excited to announce that Elastic Enterprise Search is now available on Elastic Cloud. Simply sign up for a free Elastic Cloud account and you can be up and running in a matter of minutes. The Elastic Enterprise Search solution encompasses both our Workplace Search and App Search products — a comprehensive package of search tools that dramatically simplifies the process of creating enterprise-grade search experiences for consumers, users, and teammates alike.
If you’ve worked with Elastic Support, you may have been asked to run the Support Diagnostic tool and provide the output in your support case. This is a common practice, but a lot of you out there may not know why. While the short answer is "it depends", this blog is going to explain why we keep asking for diagnostic files (as well as what’s in them). Simply put, the Support Diagnostic helps Elastic Support understand the state of your cluster.
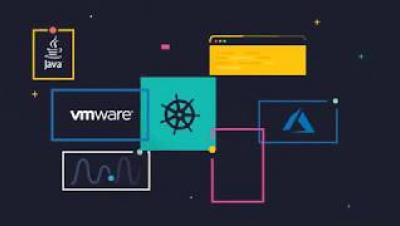
Kubernetes has emerged the de facto container orchestration technology, and an integral technology in the cloud native movement. Cloud native brings speed, elasticity, and agility to software development, but also increases the complexity — with hundreds of microservices on thousands (or millions) of containers, running in ephemeral and disposable pods. Monitoring such a complex, distributed, transient system is challenging, and at the same time very critical.
The easiest way to get the Elastic Stack up and running for this tutorial, is to spin up a 14-day free trial of our Elasticsearch Service on Elastic Cloud. A few clicks (no credit cards) and you’ll have your cluster up and running. Or if you prefer, download the Elastic Stack and install locally. All of the instructions in this tutorial can be easily amended to work with a standalone Elasticsearch cluster on your own hardware.
How annoying is it when you get a telemarketing call from a random phone number? Even if you block it, it won’t make a difference because the next one will be from a brand new number. Cyber attackers employ the same dirty tricks. Using domain generated algorithms (DGAs), malware creators change the source of their command and control infrastructure, evading detection and frustrating security analysts trying to block their activity.
You can now benefit from even more features and functionality in Elastic Cloud. In case you missed it, we’ve added powerful tools to simplify and automate operations. We’ve added support for more regions. And we’ve even added new ways to pay for, and understand your bill for Elastic Cloud. With a cup of tea and five minutes, we’ll recap them for you.
We are pleased to announce the general availability of version 7.8 of the Elastic Stack. Like most Elastic releases, 7.8 brings a broad set of new capabilities to Elasticsearch, Kibana, Logstash, and Beats, as well as the solutions built on the Elastic Stack: Elastic Enterprise Search, Elastic Observability, and Elastic Security.
Applying an observability strategy to core telecommunication data processing enables operators to answer questions that were not possible to answer before. As this approach has gained prominence, the Elastic Stack has become increasingly popular in the telecommunications space, with companies like Deutsche Telekom — their data transformation effort championed by Hans-Konrad Roth — adopting Elastic as their solution of choice for international traffic monitoring.
When viewing and analysing data with Elasticsearch, it is not uncommon to see visualizations and monitoring and alerting solutions that make use of timestamps that have been generated on remote/monitored systems. However, using remote-generated timestamps may be risky.
Jira has long been a popular issue tracking tool for development teams, but its scope has broadened quite a bit over the years, and it has bloomed into a more well-rounded project management tool as well. It’s used widely by agile teams to plan, track, and release software, along with numerous other cloud (and traditional self-managed) productivity tools.
Léargas Security (Léargas is Gaelic for “insight”) provides clients with actionable insights into anomalous or abstract behaviors through the correlation of data gathered from converged security controls: cyber and physical.
The Stack Infra team at Elastic uses many services to provide downloads for projects like Elasticsearch and Kibana to our users. One of these services is Fastly, which helps us optimize delivery to regions around the world. Keeping an eye on the performance and behavior of our CDN is important to ensure we're operating at the level we expect.
At STRABAG, we are using Elastic Cloud Enterprise (ECE) for two main use cases within our on-premises web applications. One to power different kinds of search and a second for operations where we ship more than 25,000 log entries per minute to Elastic from our load balancers. The ECE platform runs in an air-gapped environment, and we would still like to be able to use our corporate logins for the ECE platform.
At Elastic, we love data. It’s the backbone of what we do: search. And that data takes many forms. A knowledge base article showing how to reset your cable box — data. Logs from your network — data. IP addresses accessing your secure network — data. A video tutorial on how adults can use TikTok — data. The list goes on. But behind each piece of data is a story. And a person. Or a customer.
This post is the second in our series on system metrics where we cover: In the previous post, we went through some built-in tools and methods for identifying key metrics and values on your systems. In this post, we'll provide a tutorial on how to use Metricbeat to consolidate metrics, store and analyze them in the long term, and discuss some of the benefits of a centralized metric store.
We hosted our first ever virtual Elastic{ON} Gov Summit with one primary goal: recreate the collaboration and community-building we normally enjoy at our in-person Gov Summit in a new, virtual format. And we were humbled to be able to do just that. The event gathered more than 2,000 registered attendees from across government agencies and partners to collaborate while so many of us were social distancing across the nation.