Operations | Monitoring | ITSM | DevOps | Cloud
June 2022
Common DevOps Roles and Responsibilities
DevOps-oriented engineers live at the intersection of IT operations and software development: understanding much of what it takes to maintain IT infrastructure while also being able to write code and deploy new services. DevOps-minded teams not only create services — they also maintain them. A DevOps structure forces teams to take accountability for their applications and infrastructure instead of allowing developers to throw code over the proverbial wall to IT operations.
Dashboard Studio: Level-Up Your App with Dashboard Studio
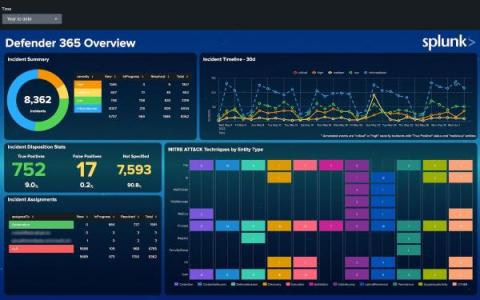
Dashboards are a powerful tool for communicating a lot of information at once. Many Splunk apps are packaged with dashboards to help you make the most of your data. For example, the Microsoft 365 App for Splunk comes with a number of dashboards to provide insights around usage, incidents, and more.
How To Prepare for a Site Reliability Engineer (SRE) Interview
Site reliability engineering continues to gain traction in software development and IT. SRE is at the crossroads of software development and IT operations. In Ben Treynor’s words, SRE is “what happens when you ask a software engineer to design an operations function.” Site reliability engineering is a way for developers to actively build services and functions to improve the resilience of people, processes and technical systems.
What's A Sysadmin? The System Administrator Role Explained
For decades, system administrators have worked largely in the shadows to maintain the accessibility and uptime of your most important IT services. And, while the rise of DevOps and cloud computing has led to more people with a hybrid sysadmin/developer skillset, the primary duties of a system administrator will always be required.
An Overview of Microsoft Azure Services
Azure is the public cloud computing platform of Microsoft and it offers: Azure comprises more than 600 cloud services and supports varied operating systems, databases and developer tools. And the best part (in our opinion)? Splunk On-Call integrates with Microsoft Azure to help on-call teams improve incident response for Azure-based environments.
Data Manager Enables Microsoft Azure Data Onboarding!
On the heels of several exciting developments about Splunk Cloud Platform announced at.conf22, I am excited to share today that Data Manager now supports onboarding of Microsoft Azure data sources, effective immediately.
Using the Density Function for Adaptive Thresholding with Splunk
It’s 3PM on a Friday, and your day is winding down. Suddenly, you get an urgent email from your boss asking you to set up an alert for monitoring volume. You consider this an easy task. You set a hard threshold for what you think is a low volume based on the last four hours of incoming data.
Time Series Forecasting Use Cases and Anomaly Detection
Wouldn’t it be great to peek into the future and find answers to the problems that you’re facing today? This may sound like science fiction, but many companies currently possess this capability, and they are creating strategies around it to strengthen their monitoring and analytical capabilities. One way is time series forecasting, a statistical method. You can take advantage of the insights of time series forecasting by using techniques like anomaly detection to gain.
Dashboard Studio: More Maps & More Interactivity
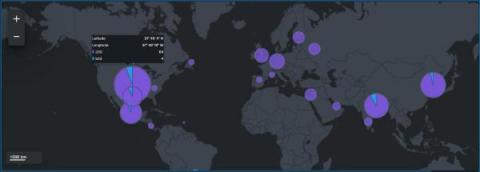
In Splunk Cloud Platform 8.2.2203, we're continuing to expand on interactivity capabilities and visualizations for Dashboard Studio. We've added the ability to use search results and job metadata as tokens, and pass tokens through drilldowns to other dashboards. There is a new map visualization for cluster maps and UI to match strings for dynamic coloring. And finally, we've included the ability to set a Studio dashboard as your home dashboard.
Log Management: A Useful Introduction
We find ourselves submerged in a sea of software applications practically all the time. Their primary job is to make life easier and help us accomplish certain tasks. However, these applications require a lot of data. What’s more, their development requires a systematic approach with proper management of that data — and its related activities. But that’s not a straightforward and simple process. What happens if these applications stop running?
Adding RUM to Your ITSI Cocktail: Content Pack for Splunk Observability V2
Want to improve your outlook with a splash of RUM? In our pursuit of connecting users to the right data at the right time, we’ve come to see Real User Monitoring as an invaluable tool for understanding the total picture when it comes to your web properties, apps, and cloud footprint. Do you find yourself asking any of these questions?
Tech Talk: DevOps Edition - Monitor and Alert on Your Kubernetes Clusters in Seconds
Network Configuration, Monitoring and Management Explained
Network configuration entails setting up your network to support local or remote network communication. This configuration allows for wired or wireless connection and entails the installation of network hardware, software, and devices. In this article, let’s take a look at network configuration, including the benefits, various types and tools, and how to monitor and manage the network.
AIOps No Bullsh...Just IT
The IT Operations space has a ton of recent advancements, and arguably the most elusive Observability unicorn for many organizations has got to be "AIOps," perhaps with "proactive monitoring" coming in as a close second place. You may be thinking.
What Are Preload Resource Hints?
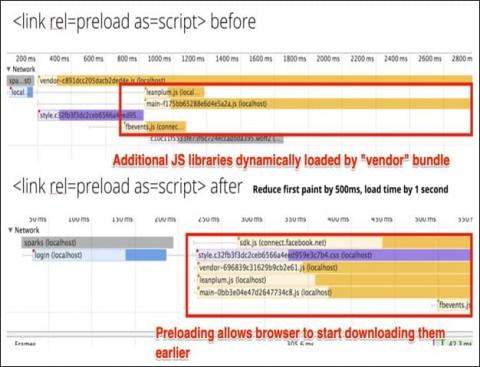
Preloads are a powerful optimization technique that can make significant improvements to crucial performance metrics such as Core Web Vitals. I have written on prefetching a DNS lookup or even preconnecting to a domain. Preloading is a much more powerful extension of these concepts because it enables you to download entire resources in advance. In this article, let’s look at.
What Is a DNS Prefetch?
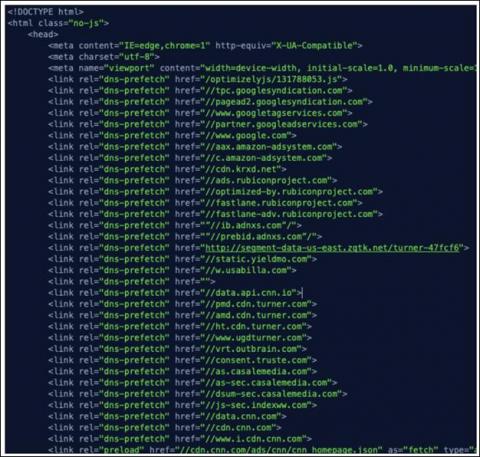
This article helps you understand DNS prefetching, one type of resource hint, including what they are, why and how to use them, and best practices for auditing and scaling them.
What Are Preconnect Resource Hints?
In this article, let’s take a look at preconnect resource hints — what they are, why and how to use them, and best practices for auditing and scaling them.
Monitoring APIs with Authentication
With the rise of microservices and distributed systems, more and more data migrates through APIs. So, let’s look at the best ways to monitoring APIs using authentication.
Integrating API Monitoring Into Your Performance Management Strategy
APIs have existed nearly as long as websites themselves. But because APIs are primarily consumed by programs instead of people, they tend to be less visible than applications or sites directly accessed by users. The result: APIs often receive far less attention from a site reliability engineering (SRE) and monitoring perspective than other parts of application environments.
The State of Availability Today: Availability Monitoring & Management
At first glance, availability monitoring may seem like one of the more mundane responsibilities of site reliability engineering (SRE) and IT operations teams. Determining whether an application is available may appear to be relatively straightforward, especially for teams that focus simply on monitoring certain transactions or services. This may have been true in the past.
Synthetic Monitoring Phases & Strategies
Synthetic monitoring tools have long formed a core part of application performance management and monitoring toolsets. Yet no matter how familiar you are with synthetic monitoring, there is likely room to get more out of it than you currently are. Indeed, the default approach to synthetic monitoring tends to involve using it reactively: problems occur in production, and your team uses synthetic monitoring to help understand and remediate them.
Synthetic Monitoring vs Real User Monitoring: What's The Difference?
It’s important for both technical and business teams to understand the different web performance monitoring options that are available as well as their various use cases and the benefits of each. In this article, we’ll compare synthetic monitoring and real user monitoring (RUM).
Synthetic Monitoring Tools: 5 Must-Have Features
There are many different classes of web performance tools, from synthetic monitoring to application performance monitoring (APM), to real user monitoring (RUM), and more. These different classes exist because each has its own strengths and weaknesses. When evaluating open-source or enterprise-grade synthetic monitoring tools, you want to look for capabilities that maximize its strengths.


