Operations | Monitoring | ITSM | DevOps | Cloud

June 2022

gRPC - Monitor gRPC calls with OpenTelemetry | Explained with a Go example

OpenTelemetry can only help in generating the telemetry data. In order to store, and analyze that data, you need to choose a backend analysis tool. In this article, we will monitor collected data from gRPC calls with SigNoz. SigNoz is a full-stack open-source APM tool that provides metrics monitoring and distributed tracing. It is built to natively support OpenTelemetry data formats. Hence, it’s a great choice for a backend analysis tool to combine with OpenTelemetry. On a side note, OpenTelemetry provides you the freedom to select a backend analysis tool of your choice.

NextJS - Monitoring your NextJS application using OpenTelemetry and SigNoz

In this video, we demonstrate how to implement OpenTelemetry NextJS libraries for a sample NextJS application and then visualize the collected data in SigNoz. More about SigNoz: SigNoz - Monitor your applications and troubleshoot problems in your deployed applications, an open-source alternative to DataDog, New Relic, etc. Backed by Y Combinator. SigNoz helps developers monitor applications and troubleshoot problems in their deployed applications. SigNoz uses distributed tracing to gain visibility into your software stack.

Elixir - Monitor your Elixir Application with OpenTelemetry and SigNoz

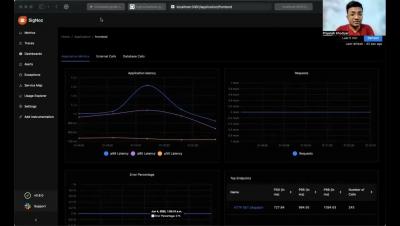
SigNoz provides query and visualization capabilities for the end-user and comes with out-of-box charts for application metrics and traces. Now let’s get down to how to implement OpenTelemetry in your Elixir application. More about SigNoz: SigNoz - Monitor your applications and troubleshoot problems in your deployed applications, an open-source alternative to DataDog, New Relic, etc. Backed by Y Combinator.

Docker Stats | Understand how to monitor Docker Metrics with docker stats

Docker containers are transient (lasting for a very short time), spawning quickly and in high numbers, which causes metrics bursts. This makes monitoring a challenge due to Docker's scaling and redeployment features. Docker stats is a built-in feature of Docker containers. The docker stats command returns a live data stream of your running containers. Docker is a containerization platform that lets you separate your applications from your infrastructure to deliver software quickly.

Ruby - Tracing a Ruby application with OpenTelemetry for performance monitoring

Tracing your application can give the much needed context required to troubleshoot performance issues. OpenTelemetry is an open-source project that can help you to set up an observability framework for your cloud-native applications. In this tutorial, we will use SigNoz as our backend analysis tool. SigNoz is a full-stack open-source APM tool that can be used for storing and visualizing the telemetry data collected with OpenTelemetry. It is built natively on OpenTelemetry and works on the OTLP data formats.

NestJS - Monitoring your NestJS Application using OpenTelemetry and SigNoz

Monitoring your NestJS application is critical for performance management. But setting up monitoring for NestJS applications can get cumbersome requiring multiple libraries and patterns. That's where OpenTelemetry comes in. In this tutorial, we will use SigNoz as a backend. SigNoz is an open-source APM tool that can be used for both metrics and distributed tracing. Let's get started and see how to use OpenTelemetry for a NestJS application.

Prometheus vs Elasticsearch stack - Key concepts, features, and differences

Prometheus and the Elasticsearch stack are both used for monitoring applications. But while Prometheus is primarily meant to monitor metrics, the Elasticsearch stack or the ELK stack is mainly used to collect, store, analyze, and visualize application logs. In this article, we will see what Prometheus and ELK stack is and compare their differences. Prometheus is a time-series metrics monitoring tool. Prometheus enables you to capture time-series data as metrics.

Rust - Implementing OpenTelemetry in a Rust application for performance monitoring

In this tutorial, we will use OpenTelemetry to instrument a PHP application for telemetry data. OpenTelemetry can be used to trace Rust applications for performance issues and bugs. OpenTelemetry is an open-source project under the Cloud Native Computing Foundation (CNCF) that aims to standardize the generation and collection of telemetry data. Telemetry data includes logs, metrics, and traces. More about SigNoz.

PHP - Monitoring a PHP application with OpenTelemetry and SigNoz

In this tutorial, we will use OpenTelemetry to instrument a PHP application for telemetry data. It’s essential to monitor your PHP application for performance issues and bugs. Application owners need good telemetry data from their application in order to monitor it effectively. That’s where OpenTelemetry comes into the picture. OpenTelmetry provides client libraries for many programming languages, including PHP, which can be used to instrument applications.

Implementing OpenTelemetry in React applications | Tutorial

More about SigNoz: SigNoz - Monitor your applications and troubleshoot problems in your deployed applications, an open-source alternative to DataDog, New Relic, etc. Backed by Y Combinator. SigNoz helps developers monitor applications and troubleshoot problems in their deployed applications. SigNoz uses distributed tracing to gain visibility into your software stack. If you need any clarification or find something missing, feel free to raise a GitHub issue with the label documentation or reach out to us at the community slack channel.

1000+ Community Members, Async APIs for retention settings & improved UI - SigNal 13

Every month, our team works on two major fronts: shipping new features asked by users and iterating on shipped features to make them better for existing users. Last month, our team worked closely with users to ship a lot of product improvements both in UI and backend performance. Alongside that, we have been working on metrics builder and log management, two major feature upgrades to SigNoz.

OpenTelemetry PHP | Monitoring a PHP application with OpenTelemetry

PHP is a widely popular server-side language and enjoys the top spot in terms of market share. Many world-famous organizations like Facebook have their applications written in PHP. WordPress, which powers 43% of all websites, is also built on PHP. In this tutorial, we will use OpenTelemetry to instrument a PHP application for telemetry data. It’s essential to monitor your PHP application for performance issues and bugs.

MEVN stack tutorial | Build a CRUD app using Vue 3, Node, Express & MongoDB

MEVN stack is a popular Javascript software stack that has become very popular in recent times to build powerful web applications. MEVN stack involves four technologies to build an end-to-end web application, namely, MongoDB, Expressjs, Vuejs, and Nodejs.

OpenTelemetry in a C# .NET application | Implementation guide

C# (pronounced C-Sharp) is a simple, modern, object-oriented, and type-safe programming language. ASP.NET is one of the top frameworks for building modern applications using C#, F#, or Visual Basic. OpenTelemetry is one of the popular CNCF projects. Some other notable projects under CNCF include Kubernetes, Helm, and Fluentd. The OpenTelemetry project aims to create an open source web standard for instrumenting cloud-native applications.