Operations | Monitoring | ITSM | DevOps | Cloud

APM

The latest News and Information on Application Performance Monitoring and related technologies.

Getting Started with OpenTelemetry Visualization

OpenTelemetry is a Cloud Native Computing Foundation(CNCF) project aimed at standardizing the way we instrument applications for generating telemetry data(logs, metrics, and traces). However, OpenTelemetry does not provide storage and visualization for the collected telemetry data. For OpenTelemetry visualization, you need to use a backend that can ingest the collected data and provide a web UI to visualize it.

Comparing The Top 9 Datadog Alternatives in 2024

Are you looking for a DataDog alternative? Then you have come to the right place. In this article, we will go through top 9 DataDog alternatives. One of the biggest challenge users face with DataDog is its pricing policies. Its complex SKU-based pricing policy leads to unpredicatble bills. DataDog is a cloud monitoring software that provides an array of tools for monitoring different aspects of your application and infrastructure.

DataDog vs Grafana - Key Features & Differences

DataDog is a paid SaaS tool that provides a range of products for monitoring applications and tech infrastructure. While Grafana is an open-source web visualization tool that can be used with a variety of data sources to create dashboards. If you're looking for a one-stop observability solution and price is not a concern for you, choose Datadog. In case you're looking to visualize data from a lot of different data sources especially time-series data, then choose Grafana.

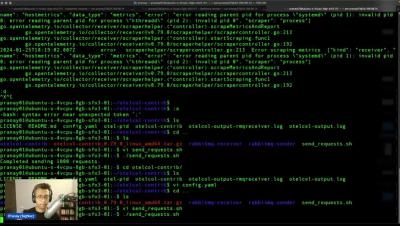
RabbitMQ monitoring with OpenTelemetry

More about SigNoz: SigNoz - Monitor your applications and troubleshoot problems in your deployed applications, an open-source alternative to DataDog, New Relic, etc. Backed by Y Combinator. SigNoz helps developers monitor applications and troubleshoot problems in their deployed applications. SigNoz uses distributed tracing to gain visibility into your software stack. If you need any clarification or find something missing, feel free to raise a GitHub issue with the label documentation or reach out to us at the community slack channel.

Feature Spotlight - Introducing Smart Agent for Cisco AppDynamics

Cisco AppDynamics Smart Agent will transform how you manage your agent lifecycle. It orchestrates your agent lifecycle tasks through an enhanced UI, or through an advanced CLI. Learn about the recently released Smart Agent and Agent Management for Cisco AppDynamics in the video below. It includes an overview and short demonstration of the primary use case: identifying agents that must be updated, and how to perform agent updates in bulk.

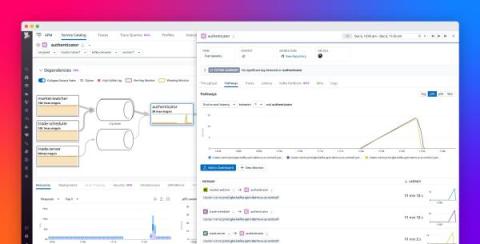
Troubleshoot streaming data pipelines directly from APM with Datadog Data Streams Monitoring

When monitoring applications with streaming data pipelines, there are additional complexities to consider that are not present in traditional batch-processing systems. Whether you’re using streaming data pipelines to power a digital trading platform, capture sensor data from an IoT device, or recommend news articles to users, it can be challenging to identify the root cause of delays when you’re dealing with distributed systems, real-time data, and the dynamic nature of events.

Monitoring your Spring Boot Application using OpenTelemetry

OpenTelemetry can auto-instrument your Java Spring Boot application to capture telemetry data from a number of popular libraries and frameworks that your application might be using. It can be used to collect logs, metrics, and traces from your Spring Boot application. In this tutorial, we will integrate OpenTelemetry with a Spring Boot application for traces and logs. OpenTelemetry is a vendor-agnostic instrumentation library that is used to generate telemetry data like logs, metrics, and traces.