Operations | Monitoring | ITSM | DevOps | Cloud
How to get data flowing through Sentry
How to configure Sentry
How to Implement and Configure Sentry
Crash-free sessions, carefree users with Release Health
Week after week, developers work tirelessly to publish updates that improve the stability of their mobile applications, so people like me can rely on our phones for work, play, and even occasional childcare. So to all those on a bug fix rotation right now: thank you. Unfortunately, my appreciation isn’t actually a great indicator of a release’s success. Developers are looking to Sentry to provide insights like version adoption, crash-free sessions, crash-free users, etc.
Find What You Need! All About Our New Search Tool.
Product Releases Update Our new Search tool allows you to quickly build detailed queries without having to leave the page. Our new search tool expands on our column filtering feature. You can now create even more detailed queries by filtering on 20 unique criteria. New for this release is the ability to search Call Stack Function Names, Call Stack File Names, and Call Stack Line Numbers.
What is Subkeying?
Subkeying is a way to group a set of crashes at some level other than the top level of the call stack. Subkeying is a way to group a set of crashes at some level other than the top level of the call stack. At BugSplat, crashes are grouped by a stack key and groups of crashes can be found on the Summary page. By Default, BugSplat groups crashes using the topmost level of a call stack. A subkey is created when crashes are grouped at a level other than the top level of a call stack.
Build or buy your crash reporting tool?
You’re in the process of creating and launching new softwareand you want it to be as stable as possible. Or, maybe your software has been running for a while, but you’re frustrated with the bug-reporting workflow in place. Either way it’s time to look for a crash reporting process that fits your application. This leads to a natural question: Should we build it? Or should we buy it? To expand on this question, which will be better for my business?
Customizing the UE4 Crash Report Client
Crash Report Client is an Unreal Engine tool that allows developers to capture C++ crash reports from supported platforms. At crash time, a dialog is shown to the user so that they may add comments or replication steps to the details of the report. Once the crash report is submitted, it’s pushed to one of Epic’s servers so that developers can review the crash and fix the underlying issue. Often, the crash is a result of code that wasn’t written by Epic.
Let's get ready to monitor!
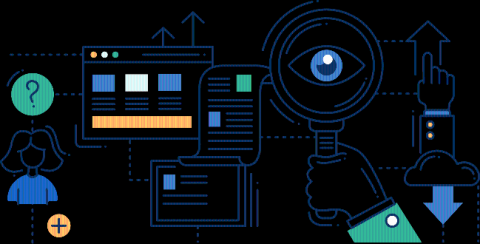
At Sentry, we often get asked how error monitoring is different from APM or logging. To help answer this, I’ve broken down the different types of monitoring into four major categories.


