Learn how to gain real-time visibility into your web applications with Grafana Faro! In this hands-on tutorial, we’ll walk through instrumenting a JavaScript app with Faro.
In 2020, we launched the Google Sheets data source for Grafana, providing organizations with real-time data visualization capabilities for all their go-to spreadsheets. Since then, thousands of users have installed the data source to quickly and easily derive insights from their spreadsheet data. In this blog post, we’ll explore key features of the Google Sheets data source, as well as some helpful resources to install and start using the data source today.
Shopify is a fantastic tool for organizations who want to sell products, but don’t want to build or maintain an e-commerce platform themselves. Even some of the largest brands that have built their own e-commerce platforms in the past have seen the value of using Shopify to accelerate their business. As your Shopify site scales and grows, however, you may need more insight into the performance of your store.
Andrew Dedesko is a backend software engineer with 13 years of experience. He became very interested in metrics and alerting after being woken up countless nights while on call. Outside of work, Andrew likes cycling, camping, making s’mores, and pancakes. Adriano Mariani is a software engineer with three years of experience specializing in backend software development. Currently, Adriano is working at Kijiji on SEO-related initiatives.
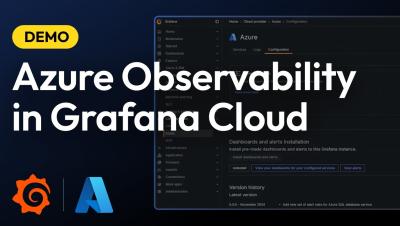
Microsoft Azure Cloud monitoring has never been more streamlined! In this video, Vasil Kaftandzhiev, Product Manager for Cloud Provider Observability in Grafana Cloud, walks you through how easy it is to monitor Azure Cloud Services with Grafana. With out-of-the-box dashboards, you can instantly visualize key metrics for essential Azure services like: API Gateway Queue Storage Virtual Machines Log Storage Events Hub Network Load Balancers SQL.
Synthetic monitoring is a critical practice to proactively track the health and performance of web applications. By simulating user interactions, this approach helps developers identify issues before they impact real users. One of the simplest forms of synthetic monitoring is known as a ping check, which verifies whether an endpoint is reachable. In this blog post, we’ll take a closer look at what a ping check is, and then walk through how to perform one using Grafana Cloud Synthetic Monitoring.
Organizations around the world use Microsoft Azure to power their businesses. The cloud computing platform includes hundreds of products and services organizations can use to build and manage applications, but monitoring those environments can often feel like navigating a maze of fragmented data, tools, and processes.
Grafana’s extensibility has always been one of the keys to its success. It comes with a wide range of data sources that allow you to query your data no matter where it lives, visualizations to help you quickly make sense of that data, and apps that can provide complete observability solutions, all in a single package.
Logs play a critical role in observability, but they do come with their own challenges. Grafana Loki, our horizontally scalable, highly available, multi-tenant log aggregation system, addresses these challenges head on, giving you an open source tool that’s both cost effective and easy to operate.
This year Grafana Mimir — the open source, horizontally scalable, multi-tenant time series database (TSDB) — will celebrate its third anniversary. Over the years, Mimir has become the go-to, Prometheus-compatible metrics backend within the open source community, with 29 maintainers and more than 4.6k GitHub stars. Since introducing Mimir, we’ve worked hard to deliver on our promise of making it the most scalable and performant open source TSDB in the world.