Observe Your Google Cloud Infrastructure | Demo: New Grafana Cloud Application | Grafana Labs
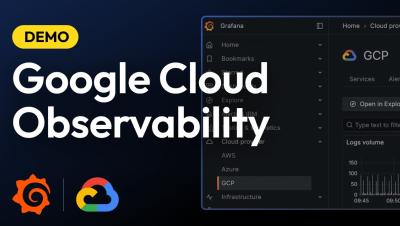
Want to monitor your Google Cloud infrastructure more effectively? Join Vasil Kaftandzhiev as he introduces Grafana Cloud’s new application designed specifically for Google Cloud observability. In this video, you'll discover how to: Optimize and troubleshoot your Google Cloud services Leverage out-of-the-box dashboards with key metrics and thresholds Set up comprehensive alerting for real-time incident response Streamline log management with an all-in-one logs view for faster root cause analysis Configure logs and metrics effortlessly using Grafana Alloy.