Operations | Monitoring | ITSM | DevOps | Cloud

Grafana

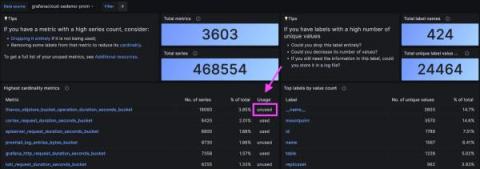
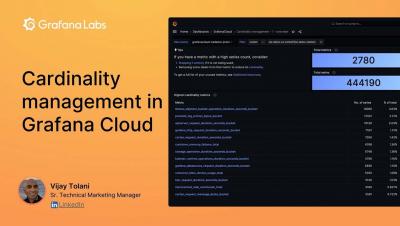
Identify unused, costly metrics with Cardinality Management dashboards in Grafana Cloud

Organizations are dealing with an explosion of metric data as they shift to cloud native architectures and adopt tools like Prometheus and Kubernetes. This in turn can lead to surges in spending on observability metrics. So while teams want a way to scale out metrics adoption to improve their observability — and thus, improve system performance and reliability — they also need to be mindful of skyrocketing costs that could scuttle those efforts before showing meaningful results.

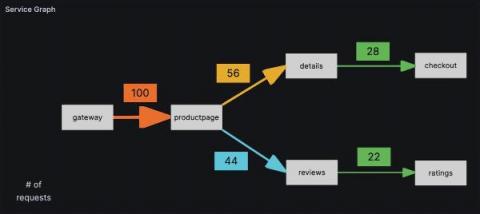
Use Canvas panels to customize visualizations in Grafana

The Canvas panel, which will be Generally Available in Grafana 10, combines the power of Grafana with the flexibility of custom elements. Canvas visualizations are extensible, form-built panels you can use to explicitly place elements within static and dynamic layouts. This empowers you to design custom visualizations and overlay data in ways that aren’t possible with standard Grafana panels, all within Grafana’s UI.

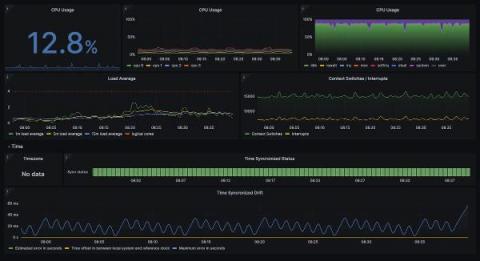
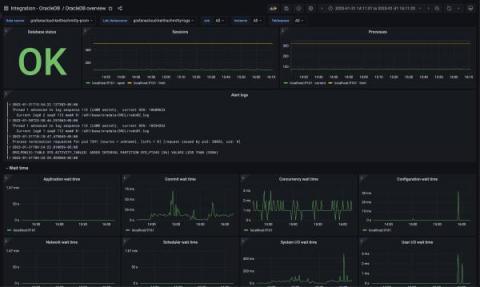
How to monitor Oracle Database with Grafana Cloud

Oracle Database is an enterprise multi-model database system capable of handling large amounts of data across multiple database servers with support for a wide variety of workloads. It’s a widely used and proven database software, so we are incredibly pleased to announce that it now has a dedicated cloud integration in Grafana Cloud. With the Oracle Database (OracleDB) integration, you can monitor your database’s performance with ease.

Introducing Adaptive Metrics: A new cost management feature in Grafana Cloud

You’ve convinced your organization that cloud native is the way forward. You’ve championed Kubernetes and sworn by Prometheus. You’ve onboarded multiple teams to your centralized observability platform. Then you open your latest bill and see a lot of commas in your invoice, and a sinking feeling sets in. Sound familiar? We’re keenly aware of the pain this can bring. As metric cardinality grows in cloud native environments, so does the cost to store and retrieve the data.

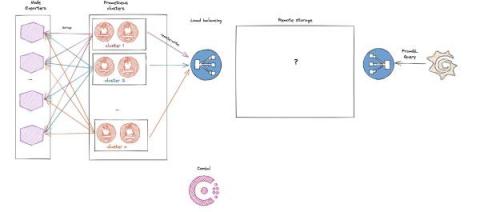
5 reasons why OVHcloud migrated its time series data to Grafana Mimir

A sysadmin in the high performance computing world since 2008, Wilfried Roset is now working with the open source databases and observability environment at OVHcloud. He leads a team focused on building industrialized, resilient, and efficient solutions. For nearly two decades, OVHcloud has been a leader in cloud hosting and has been Europe’s largest provider since 2011. To serve our 1.4 million customers globally, we need a reliable and scalable observability platform.

Introducing the Grafana Labs Bug Bounty Program

At Grafana Labs, we value the open source community and recognize the power of crowdsourcing. This is why we have decided to launch our very own bug bounty program, managed in-house by our own team, to encourage ethical hackers from around the world to help us find and responsibly report security vulnerabilities in Grafana Labs software.

New in Grafana 9.5: Debug Grafana instances faster with support bundles

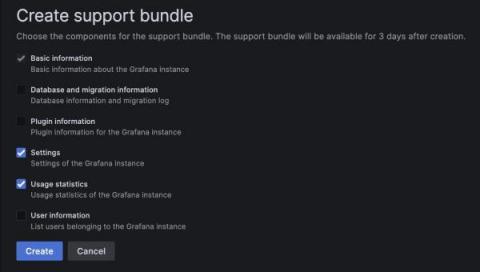
With the arrival of Grafana 9.5, we’re excited to introduce Grafana support bundles — a tool to help debug your Grafana instance faster and more easily. Support bundles provide a simple way to gather and share information about your Grafana instance, and this feature is available across all tiers in Grafana Cloud as well as in Grafana OSS and Grafana Enterprise.