Operations | Monitoring | ITSM | DevOps | Cloud

Sumo Logic

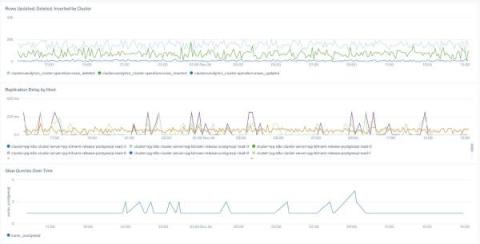
Efficiently Monitor the State of Redis Database Clusters

Monitoring Redis, the open source in-memory data platform, is complicated enough when you are hosting your Redis instance on just a single server. It gets even more complex when you build a Redis cluster that consists of multiple nodes and distribute your data across them. But as long as you know which metrics to prioritize and how to collect them, Redis monitoring is feasible enough. This article offers an overview of how to monitor the state of Redis database clusters.

Sumo Logic to accelerate modernization of security operations with proposed acquisition of DFLabs

At Sumo Logic, our belief is that security operations is no longer a human scale problem. We need tools and technologies to aid our defenders and responders to be able to process, investigate and respond at machine speed. Our vision for modernizing security operations to deal with threats at machine scale has always encompassed more than just SIEM.

Forrester TEI study: Sumo Logic's Cloud SIEM delivers 166 percent ROI over 3 years and a payback of less than 3 months

We are seeing a renewed focus on accelerating digital transformation projects across business ecosystems and workflows within our customer base. These projects are enabling key business outcomes and this organizational transformation has given security and IT leaders the catalyst and opportunity to modernize security operations while eliminating on-premises debt.

Sumo Logic Continues to expand Public Sector Footprint

In a recent press release entitled ‘Sumo Logic Achieves FedRAMP Moderate Authorization’, dated Feb 2, 2021, the pioneer in continuous intelligence announced its Continuous Intelligence Platform™ has achieved Federal Risk and Authorization Management Program (FedRAMP™) Authorization at a Moderate impact level enabling the company to help public sector organizations get real-time insights into their complex on-premises and cloud environments.

Observability vs. Monitoring: What's the Difference?

One of the more delicate debates in the DevOps world is what observability has to do with monitoring. Is observability just a trendy buzzword that means the same thing as monitoring? Is observability an improved version of monitoring? Are monitoring and observability different types of processes that solve different problems? The answer to those questions depends in part on your perspective.

Service Map & Dashboards Provide Insight into Health and Dependencies of Microservice Architecture

With almost every blog you read about monitoring, troubleshooting, or more recently, the observability of modern application stacks, you’ve probably read a statement saying that complexity is growing as a demand for more elasticity increases which makes management of these applications increasingly difficult. This blog will be no exception, but there’s a good reason for that: we just enabled the first Sumo Logic customers with powerful new tools to tackle these exact challenges.

Analyze your tracing data any way you want with Sumo search query language

It’s been almost a year since I shared some thoughts about distributed tracing adoption strategies on this blog. We have discussed how different approaches between log vendors and application performance management (APM) vendors exist in the market and how important that is to allow users to analyze the data, including custom telemetry, the way they want.

Analyze JMX to Better Assess The Health Of Your Java Applications

Java Management Extensions, or JMX, was first added to J2EE, and it has been part of J2SE since the 5.0 release. The JMX API aims to provide a standard for monitoring and managing Java-enabled applications and services. In this article, we will explain the JMX architecture and show you how to pull the metrics that it generates into your Sumo Logic account in order to gain unique insights and a more thorough understanding of the health of your application and services.