Operations | Monitoring | ITSM | DevOps | Cloud

Elastic

Elastic Stack Monitoring with Elastic Cloud on Kubernetes

Elastic Cloud on Kubernetes (ECK) is the official operator for provisioning Elastic Stack deployments in Kubernetes. It orchestrates not only day-one provisioning, but also has the processes and best practices for day-two management and maintenance baked in. If you want to run your own Elastic Stack deployment on Kubernetes, then look no further than ECK!

Putting anomalies into context with custom URLs in Kibana

Machine learning in the Elastic Stack provides you with an intuitive way to detect anomalies in vast data sets. But even the most sophisticated anomaly detection job might not reveal the root cause of anomalous behavior. After an anomaly is detected, you may need to dive into further analysis, review multiple corresponding metrics, and investigate how they relate to the anomalous spike.

Monitoring infrastructure and microservices with Elastic Observability

Trends in the infrastructure and software space have changed the way we build and run software. As a result, we have started treating our infrastructure as code, which has helped us lower costs and get our products to market more quickly. These new architectures also give us the ability to test our software faster in production-like deployments, and generally deliver more stable and reproducible deployments.

The Go client for Elasticsearch: Working with data

In our previous two blogs, we provided an overview of the architecture and design of the Elasticsearch Go client and explored how to configure and customize the client. In doing so, we pointed to a number of examples available in the GitHub repository. The goal of these examples is to provide executable "scripts" for common operations, so it's a good idea to look there whenever you're trying to solve a specific problem with the client.

Monitoring Java applications with Elastic: Multiservice traces and correlated logs

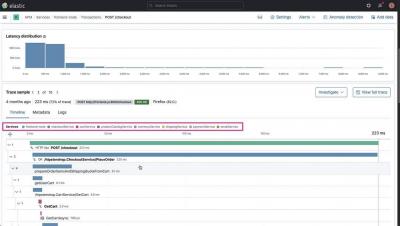
In this two-part blog post, we’ll use Elastic Observability to monitor a sample Java application. In the first blog post, we started by looking at how Elastic Observability monitors Java applications. We built and instrumented a sample Java Spring application composed of a data-access microservice supported by a MySQL backend. In this part, we’ll use Java ECS logging and APM log correlation to link transactions with their logs.

Enriching data with GeoIPs from internal, private IP addresses

For public IPs, it is possible to create tables that will specify which city specific ranges of IPs belong to. However, a big portion of the internet is different. There are company private networks with IP addresses of the form 10.0.0.0/8, 172.16.0.0/12 or 192.168.0.0/16 scattered in every country in the world. These IP addresses tend to have no real information for the geographic locations.

How to set up OpenID Connect on Elastic Cloud with Azure, Google, or Okta

OpenID Connect (OIDC) is an authentication layer based on OAuth 2.0 protocol that provides a way to identify and authenticate users via an authorization server. OAuth 2.0 authorization servers are managed by identity providers. In the domain associated with OIDC, they are also called OpenID Connect Providers (OPs). OIDC allows users to connect to web applications in a simplistic single sign-on (SSO) manner thanks to the identity provider.

Elastic Workplace Search and Gmail: Unified search across all your content

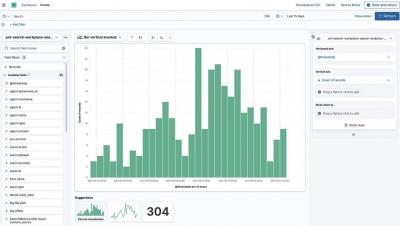
As work from home has ballooned in 2020, virtual methods for communicating with colleagues have become more critical than ever. Same goes for all the useful productivity and collaboration tools at our disposal. The emerging downside is the difficulty of finding needed information among so many tools. Compounding the problem is the tendency for info to get siloed off by department.

Snapshot Lifecycle Management - Sept 9, 2020 Elastic Meetup

Snapshot Lifecycle Management (SLM) allows you to set up snapshot lifecycle policies to automate the timing, frequency, and retention of snapshots. In this talk we will cover the basics of registering a repository, setting up a snapshot policy and taking the test snapshots. If you are aware of the necessity of taking frequent snapshots for high availability/disaster recovery and you’ve been looking for a way to automate the whole process - then SLM is the right tool for you!

Automate Elastic Cloud workflows using an SDK and Elasticsearch Service API

We recently announced the general availability of our Elasticsearch Service API. APIs help to automate tasks such as creating and scaling deployments, integrating with existing workflows, and testing. The Elasticsearch Service API supports the Open API Specification, which allows you to use tools like Swagger to generate software development kits (SDKs) in any programming language. You can import the API spec onto Postman and create a Postman Collection to create a test suite.