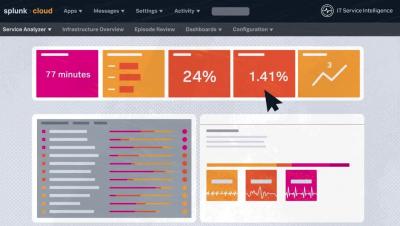
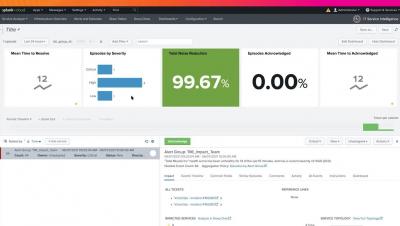
Operations | Monitoring | ITSM | DevOps | Cloud

Prevent Data Downtime with Anomaly Detection

A couple months ago, a Splunk admin told us about a bad experience with data downtime. Every morning, the first thing she would do is check that her company’s data pipelines didn’t break overnight. She would log into her Splunk dashboard and then run an SPL query to get last night’s ingest volume for their main Splunk index. This was to make sure nothing looked out of the ordinary.

The Five Tenets of Observability

A new year is a chance to have a new start, and one thing that it’s a great opportunity to think about is the monitoring and observability platform you’re using for your applications. If you’ve been using a legacy monitoring system, you’ve probably heard about observability all over the ‘net and want to figure out if this is really something you need to care about.

Getting Ready for a smooth, speedy migration to the Splunk Cloud Platform

This video shows you how a little bit of preparation before you kick off your cloud migration can lead to a speedy, smooth ride. Additionally, this video will help you decide on your migration strategy that is best for your environment and show you how to assess the efforts required for migrating your environment to the Splunk Cloud Platform.

Kickstart your Splunk App with @Splunk/Create

I’ve been contributing to, and creating, Splunk apps for the better part of the last 10 years. But never have I felt more excited to be a Splunk Developer than right now. One of the primary reasons why I am so excited is because of build tools like @splunk/create. At Splunk, we recognize that developers are so crucial to our entire ecosystem.

Show it Off with Splunk TV! More Ways to Display Your Best Dashboards

Splunk TV lets you easily display your data on the big screen to visualize and monitor what’s going on in your business. Splunk TV is optimized for a hands-off experience, with slideshows and automatic scrolling so you can display the most important metrics securely and easily. We’re happy to announce that in addition to Classic (Simple XML) dashboards, we now support Studio Dashboards and IT Service Intelligence Glass Tables.

Refined User Experience, New Executive Visibility, and Enhanced Cloud Monitoring with Splunk Enterprise Security 7.0

Just like that, another year has gone by full of remote work, virtual conferences, and lengthy Zoom calls. And, although we were not able to see our fellow Splunkers in person at.conf21 that didn’t stop us from previewing the latest enhancements to Splunk Enterprise Security. And now, it gives us great pleasure to announce that Enterprise Security 7.0 is available!

Splunk Enterprise Logs Now Available in Splunk Observability for Simplified Troubleshooting

We are excited to announce that Splunk Log Observer Connect for Splunk Enterprise, previewed at.conf21, is now generally available! Log Observer Connect is a new feature that lets observability users explore the data already being sent to existing Splunk instances with Splunk Log Observer’s intuitive no-code interface for faster troubleshooting and root-cause analysis.