Operations | Monitoring | ITSM | DevOps | Cloud

Splunk

Splunk SOAR Playbooks: Suspicious Email Domain Enrichment

Despite the myriad pathways to initial access on our networks, phishing remains the single most popular technique for attackers. The open nature of email and our reliance on it for communication make it difficult for defenders to classify messages, so it is no surprise that suspicious email investigation is a top use case for automation. Today, we are releasing a new community playbook for Splunk SOAR (previously Splunk Phantom) to help enrich suspicious email events.

Rappi Relies on Splunk Observability Cloud to Meet its 30-Minute Guarantee

Hear from Rappi’s EVP Engineering, Alejandro Comisario about how as one of the largest technology startups in Latin America, the on-demand delivery service relies on the Splunk Observability Cloud for real-time, end-to-end visibility across its complex backend system of 1k+ microservices. Since COVID-19 Rappi has grown 300%, relying on Splunk’s real-time observability to eliminate app issues for customers and stay on top of its infrastructure, applications, and overall business. With Splunk APM, Rappi now has in-depth insights into service behavior and directed troubleshooting, bringing developers’ mean-time-to-resolution (MTTR) down by 90+%.

Splunk Observability Cloud: Cutting through the complexity of modern applications

As infrastructure modernizes, it becomes more complex and more difficult to monitor and operate. To truly understand what your systems are doing, you need full-stack, end-to-end observability. We built Splunk Observability Cloud to eliminate your blind spots and go from alert to problem resolution in seconds–not hours. Splunk Observability Cloud provides one unified experience for seamless monitoring, troubleshooting, and resolution across any stack, at any scale.

Splunk Log Observer: Log analysis built for DevOps

Log analysis is a key part of getting answers from your stack, and Splunk Log Observer, part of the Splunk Observability Cloud, is built for fast, powerful log analysis. Trust the industry-leading expert on logs to help you draw insights fast from any volume of data, in real-time, without having to write any queries by hand.

Splunk Digital Experience Monitoring: Real insights into real user experience

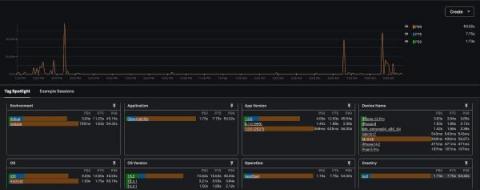
Great user experience and web performance are essential for modern applications. Time spent waiting leads customers to leave. To keep users happy and revenue flowing, you need to know what's happening from the user's perspective. Splunk Digital Experience Monitoring (RUM & Synthetics) helps you see how your users really experience your site. As part of Splunk Observability Cloud, Digital Experience Monitoring gives you an end-to-end look at how your application is performing.

Splunk APM maximizes performance by seeing everything in your application.

Innovate faster in the cloud and elevate your user experiences with Splunk APM. Built for the cloud-native enterprise, Splunk APM uses all your data in NoSample^TM^ full fidelity for you to act on your data in seconds. Free your code and future-proof your applications today with Splunk APM. Get a free trial as part of Splunk Observability Cloud today.

Explainer Video: Splunk for Infrastructure Monitoring and Troubleshooting

Wherever you are in your cloud journey and whatever your environment looks like, Splunk can monitor the performance of all your servers, containers and apps in real-time. Get real-time observability for data from any cloud, any vendor, and any service. Try our free Infrastructure Monitoring Trial and see for yourself.