Operations | Monitoring | ITSM | DevOps | Cloud

OpenTelemetry Webinars - The Open Agent Management Protocol

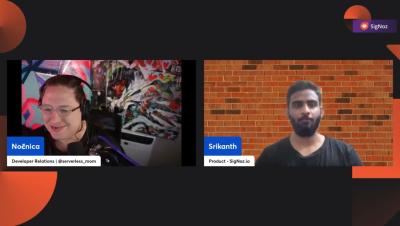
Open Agent Management Protocol (OpAMP) is the emerging open standard to manage a fleet of telemetry agents at scale. Join Nica and Srikanth as we discuss recent updates to the standard and how you can remotely manage the OpenTelemetry collector with OpAMP. SigNoz helps developers monitor applications and troubleshoot problems in their deployed applications. SigNoz uses distributed tracing to gain visibility into your software stack.

OpenTelemetry Webinars - The Trace API

Join Nica and Srikanth to talk in detail about the OpenTelemetry Trace API. We'll talk about adding spans, events, attributes and other extra info, whether it's really possible to replace logs with traces, and more More about SigNoz: SigNoz - Monitor your applications and troubleshoot problems in your deployed applications, an open-source alternative to DataDog, New Relic, etc. Backed by Y Combinator.

Crossed 15K+ GitHub Stars, Simplified Logs Parsing with Pipelines & Trending on Hacker News - SigNal 30

Welcome to the 30th edition of our monthly product newsletter - SigNal 30! Last month, our Github repo crossed 15k+ Github stars, which is a great milestone for our open-source project and for our team. We also shipped the much-awaited logs pipeline that will make logs parsing a much better experience for our users. We also shipped other improvements to the product, hosted OpenTelemetry meetups and webinars, and much more.

Quick Demo of Logs Pipelines in SigNoz

Log pipeline allows you to preprocess your logs for enrichment, transformation, and attribute extraction before they get indexed. Here's a quick demo of using the Logs pipeline feature in SigNoz to parse Nginx logs. More about SigNoz: SigNoz - Monitor your applications and troubleshoot problems in your deployed applications, an open-source alternative to DataDog, New Relic, etc. Backed by Y Combinator.

SigNoz + Tracetest: OpenTelemetry-Native Observability Meets Testing

What is the hidden potential of OpenTelemetry? It goes a lot further than the (awesome) application of tracing and monitoring your software. The OpenTelemetry project is an attempt to standardize how performance is reported and how trace data is passed around your microservice architecture. This context propagation is a superpower for those who adopt OpenTelemetry tracing.

Jaeger vs Prometheus - Side by Side Comparison [Updated for 2023]

Both Jaeger and Prometheus are popular open-source application performance monitoring tools. While Jaeger is an end-to-end distributed tracing tool, Prometheus is used as a time-series database for monitoring metrics. Let's dive in to explore their key features and differences. Application performance monitoring is the key to keep your system's health in check. In today's digital economy, no business can afford to have failed or delayed completion of user requests.