Operations | Monitoring | ITSM | DevOps | Cloud
New Cloud Region, Cloud Logging Update, & more!
Get more insights with the new version of the Node.js library
We’re thrilled to announce the release of a new update to the Cloud Logging Library for Node.js with the key new features of improved error handling and writing structured logging to standard output which becomes handy if you run applications in serverless environments like Google Functions!
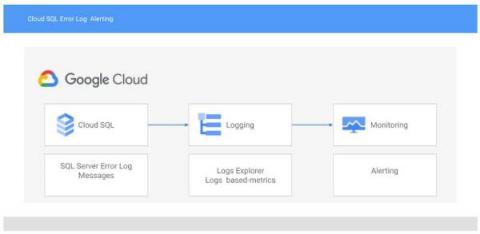
Alerting on error log messages in Cloud SQL for SQL Server
With Cloud SQL for SQL Server, you can bring your existing SQL Server on-premises workloads to Google Cloud. Cloud SQL takes care of infrastructure, maintenance, and patching so you can focus on your application and users. A great way to take better care of your application is by monitoring the SQL Server error log for issues that may be affecting your users such as deadlocks, job failures, and changes in database health.
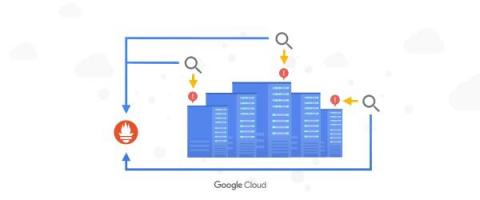
Introducing a high-usage tier for Managed Service for Prometheus
Prometheus is considered the de facto standard for Kubernetes application metrics, but running it yourself can strain engineering time and infrastructure resources when your usage grows. In March, we announced the general availability of Google Cloud Managed Service for Prometheus to help you offload that burden, and today, we’re excited to announce a new low-cost, high-usage pricing tier designed for customers who are moving large volumes of Kubernetes metrics over to the service.
Cloud SQL: Concepts of Networking
New observability features for your Splunk Dataflow streaming pipelines
We’re thrilled to announce several new observability features for the Pub/Sub to Splunk Dataflow template to help operators keep a tab on their streaming pipeline performance. Splunk Enterprise and Splunk Cloud customers use the Splunk Dataflow template to reliably export Google Cloud logs for in-depth analytics for security, IT or business use cases.
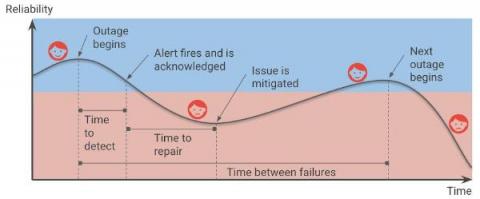
Are your SLOs realistic? How to analyze your risks like an SRE
Setting up Service Level Objectives (SLOs) is one of the foundational tasks of Site Reliability Engineering (SRE) practices, giving the SRE team a target against which to evaluate whether or not a service is running reliably enough. The inverse of your SLO is your error budget — how much unreliability you are willing to tolerate.
Utilizing IT Operations to Drive Informed Business Decisions with Broadcom Software
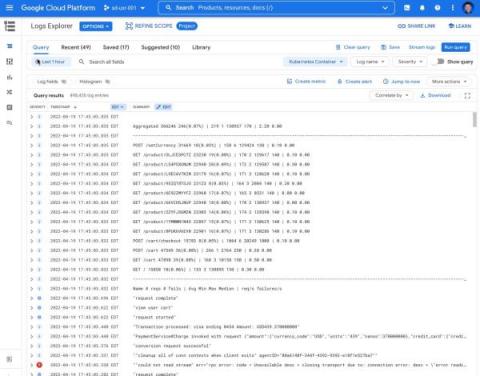
Announcing new simple query options in Cloud Logging
When you’re troubleshooting an issue, finding the root cause often involves finding specific logs generated by infrastructure and application code. The faster you can find logs, the faster you can confirm or refute your hypothesis about the root cause and resolve the issue! Today, we’re pleased to announce a dramatically simpler way to find logs in Logs Explorer.


