Operations | Monitoring | ITSM | DevOps | Cloud

Introducing a high-usage tier for Managed Service for Prometheus

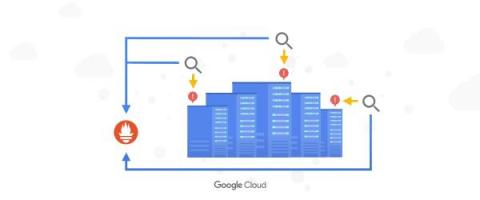
Prometheus is considered the de facto standard for Kubernetes application metrics, but running it yourself can strain engineering time and infrastructure resources when your usage grows. In March, we announced the general availability of Google Cloud Managed Service for Prometheus to help you offload that burden, and today, we’re excited to announce a new low-cost, high-usage pricing tier designed for customers who are moving large volumes of Kubernetes metrics over to the service.
Cloud SQL: Concepts of Networking

Cloud SQL provides a managed service for MySQL, PostgreSQL, and SQL Server databases as well as backups, high availability, maintenance, and so much more! In this episode of Networking End to End, Lorin Price discusses networking concepts from implementation and security to connectivity on Cloud SQL. Watch along to learn about the options for deploying Cloud SQL and tips on how to determine who and what can access your Cloud SQL instance.

New observability features for your Splunk Dataflow streaming pipelines

We’re thrilled to announce several new observability features for the Pub/Sub to Splunk Dataflow template to help operators keep a tab on their streaming pipeline performance. Splunk Enterprise and Splunk Cloud customers use the Splunk Dataflow template to reliably export Google Cloud logs for in-depth analytics for security, IT or business use cases.

Are your SLOs realistic? How to analyze your risks like an SRE

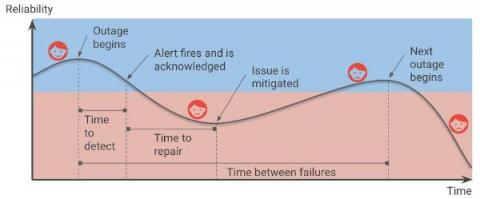
Setting up Service Level Objectives (SLOs) is one of the foundational tasks of Site Reliability Engineering (SRE) practices, giving the SRE team a target against which to evaluate whether or not a service is running reliably enough. The inverse of your SLO is your error budget — how much unreliability you are willing to tolerate.

Announcing new simple query options in Cloud Logging

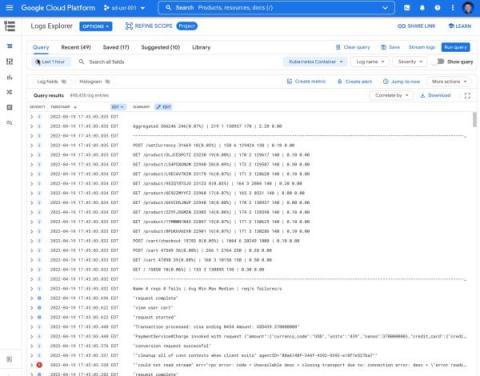
When you’re troubleshooting an issue, finding the root cause often involves finding specific logs generated by infrastructure and application code. The faster you can find logs, the faster you can confirm or refute your hypothesis about the root cause and resolve the issue! Today, we’re pleased to announce a dramatically simpler way to find logs in Logs Explorer.

Deliver exception messages through Slack and Webhooks for fast resolution

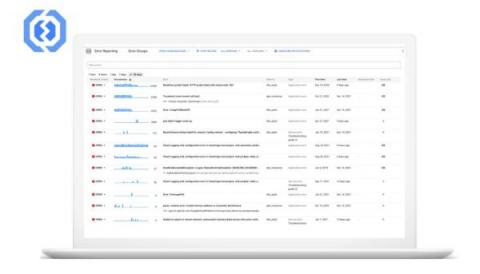
Building new applications is a lot of fun, but troubleshooting and fixing the crashes that can come with app development is not. While many organizations are fast adopting the DevOps model, there are still some legacy frameworks where developers and operations teams are separate. Developers build and submit apps to their ops team, who in turn deploy and maintain the production stack. A common issue that arises due to this workflow is the time it takes to find and resolve crashes.

Application observability made easier for Compute Engine

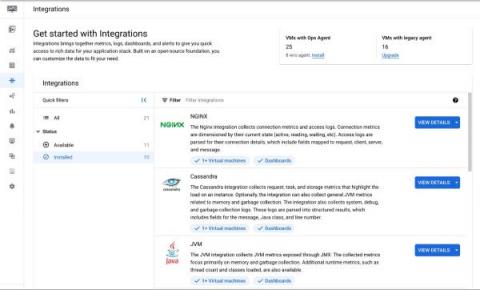
When IT operators and architects begin their journey with Google Cloud, Day 0 observability needs tend to focus on infrastructure and aim to address questions about resource needs, a plan for scaling, and similar considerations. During this phase, developers and DevOps engineers also make a plan for how to get deep observability into the performance of third-party and open-source applications running on their Compute Engine VMs.

How to set up Prometheus monitoring for your services

When you run applications in production, you need to monitor the infrastructure they run on - and collect important signals about application health like error rates and latency. In this episode of Engineering for Reliability with Google Cloud, Yuri will demonstrate how to instrument your service to expose application-specific telemetry with Prometheus and how to configure Google's managed service for Prometheus to collect those metrics.

Add severity levels to your alert policies in Cloud Monitoring

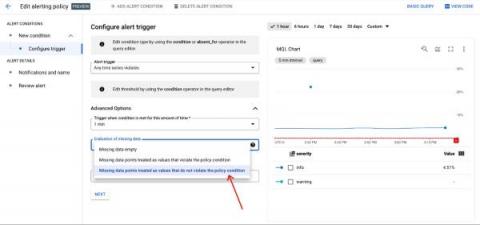
When you are dealing with a situation that fires a bevy of alerts, do you instinctively know which alerts are the most pressing? Severity levels are an important concept in alerting to aid you and your team in properly assessing which notifications should be prioritized. You can use these levels to focus on the issues deemed most critical for your operations and triage through the noise.