Operations | Monitoring | ITSM | DevOps | Cloud

SCOM

The latest News and Information on Service Center Operations Manager and related technologies.

Metrics vs. Logs vs. Traces (vs. Profiles)

In software observability, we often talk about three signal types - metrics, logs, and distributed traces. More recently I've been hearing about profiles as another signal type. In this article I will explain the different observability signals and when to use them in a clear and concise way.

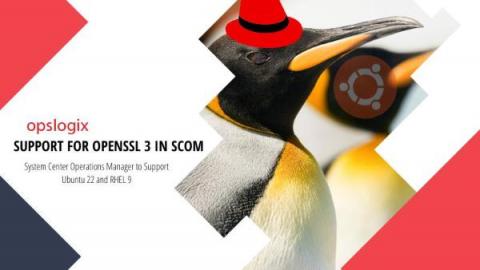
Microsoft's Cross-Platform Agent for System Center Operations Manager to Support Ubuntu 22 and RHEL 9

Since the release of OpenSSL 3 and the adoption of the technology in recent Linux kernels, a growing demand for support in System Center Operations Manager and its cross-platform agents has emerged. Together with our clients, we have been waiting and hoping for a newer release to help them monitor these newer distributions in SCOM. And now it finally looks like the wait is over.

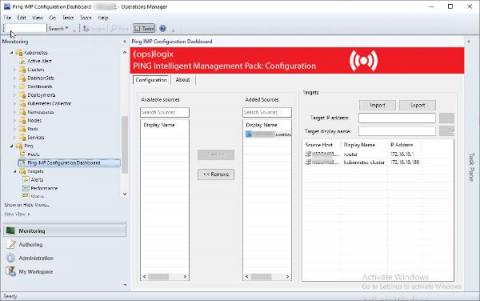
Ping Management Pack compatibility with SCOM 2022

The Opslogix Ping Management Pack is a powerful Management Pack designed to monitor the availability and performance of network devices and services. It is a must have Management Pack for SCOM, which is used by many IT professionals to monitor their infrastructure. With the release of SCOM 2022, many users are wondering whether the Opslogix Ping Management Pack is compatible with the new version.

Instrumenting Node.js code with Prometheus custom metrics

Automatic instrumentation is great, but to get the most out of your monitoring you often need to instrument your code. In this article I am going to explain how to instrument a Node.js express app with custom metrics using the Prometheus prom-client package. Although this article specifically addresses Node.js and express, my hope is that the general concepts are applicable to other languages too.

Next Level Oracle Monitoring Options Features DeepDive NiCE 2023Q1

Next Level Oracle Monitoring | Options, Features, Deep-Dive Performance, availability, and Oracle observability are the hot topics for the next decade. Get a guided tour on advanced Oracle monitoring based on Microsoft System Center Operations Manager, run by the NiCE Product Experts. The NiCE Oracle Management Pack, in conjunction with one of the big players in IT Operations Management, easily enables end-to-end Oracle observability and thus helps reduce risk and downtime.

NiCE AIX Management Pack released

From industrial business applications to finance and supercomputers, AIX runs the most demanding mission-critical workloads smoothly. AIX, IBM’s Advanced Interactive eXecutive, is a highly secure and reliable OS, which is why performance- and dependability-driven industries use AIX for their enterprise servers. In fact, the majority of Fortune 500 health care, telecommunications, energy, and financial companies run on AIX.

Dashboard Fridays: Sample Jira Dashboard

These Jira dashboards give a clear overview of your Jira instance and provide more details on the key items over which the engineering team needs oversight, like build status, critical bugs, and costs. Creating Jira dashboards in SquaredUp means Engineering Management doesn’t have the additional work of collating all the detailed Jira data to make sense of it from a high level. It also enables Release Teams to more easily consume data surfaced from all the engineering teams, while still being able to drill into the details of each dashboard as needed.