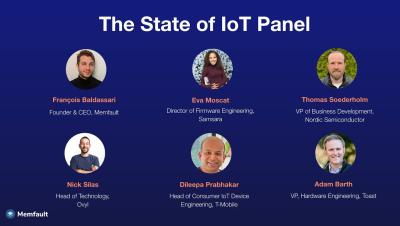
The State Of IoT Software: Sneak Peek
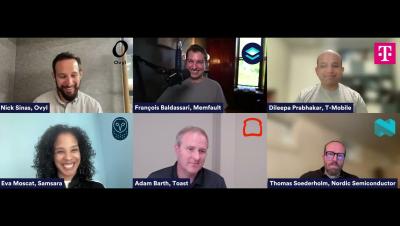
Watch the highlights from an engaging panel discussion with IoT experts from Toast, Samsara, Nordic Semiconductor, T-Mobile, Ovyl, and Memfault. The group discussed new research on the state of IoT software and shared practical advice on how to overcome common challenges.