Operations | Monitoring | ITSM | DevOps | Cloud
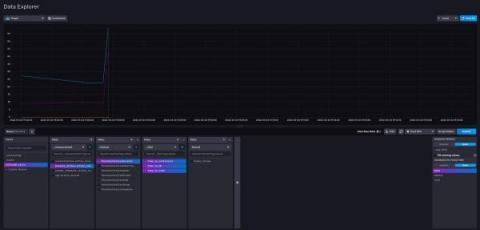
Monitoring Ruby on Rails with InfluxDB
Time series databases like InfluxDB are databases that specialize in handling time series data, which is data that is indexed by time. Unlike traditional databases, time series databases are optimized for reading and writing data with less performance consideration for updating or deleting data. Due to the time-dependent nature of time series data, time series databases are handy for application monitoring.
Tracing a Ruby application with OpenTelemetry for performance monitoring
The Sentry Ruby SDK now supports Release Health
Developers work tirelessly to publish updates to improve their products and services because, as we all know, a better user experience = happier customers. While shipping updates, features, and improved capabilities can help improve your user’s experience, introducing new code can also introduce new issues; and finding exactly what update caused a release to degrade can be time consuming and costly.
Parallelizing Queries with Rails 7's `load_async`
As you're likely well aware, Rails 7 was released last month bringing a number of new features with it. One of the features we're most excited about is load_async. This features allows for multiple Active Record queries to be executed in parallel which can be a great tool for speeding up slow requests. Since Rails introduces an entirely new infrastructure for load_async, Skylight's existing integration wasn't capturing all of these queries.
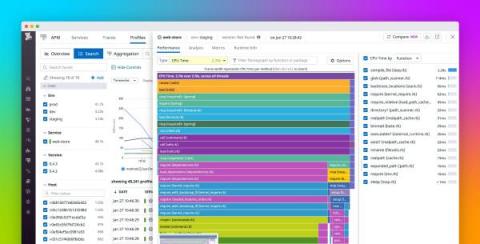
Analyze Ruby code performance with Datadog Continuous Profiler
Ruby is an object-oriented programming language celebrated for its simple and easy-to-read syntax. It powers Ruby on Rails, the open source web development framework that streamlines common development tasks involved in building web applications. We’re pleased to announce that our Continuous Profiler, which provides low-overhead, code-level performance insights, is now generally available for Ruby applications.
Configuring OpenTelemetry in Ruby
OpenTelemetry is enabling a revolution in how Observability data is collected and transmitted. See our What Is OpenTelemetry post on why this is an important inflection point in the Observability space. In this post, we’ll walk through how to configure the OpenTelemetry Gems within a Rails app.
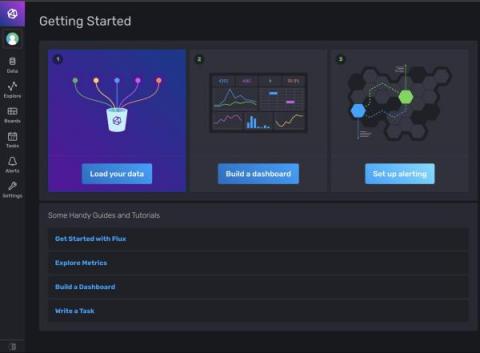
Getting Started with Ruby and InfluxDB
Scroll down for the author’s photo and bio. Time series databases like InfluxDB index data by time. They are efficient at recording constant data streams like server metrics, application monitoring, sensor reports, or any other data containing a timestamp. The structure makes analyzing change over time a breeze. This tutorial will show you how to set up InfluxDB with a sample Ruby application.
Ruby Application Manual Instrumentation for Distributed Traces
Ruby on Rails Application Monitoring with AppSignal
When running and maintaining an application in a production environment, we want to feel confident about the behavior of the application and know when it isn’t working as expected. At the least, we want to track errors, monitor performance, and collect specific metrics throughout the application.


