In this video, we’ll be covering how to deploy SquaredUp Azure Edition from the Azure Marketplace, or how to Manually Deploy on an existing server, for the first time, and how to activate.
In our latest Dashboard Fridays episode we showcase this sample Salesforce metrics dashboard built using SquaredUp. Pulling data from Salesforce, this dashboard provides visibility of new business performance for the entire company. Accessed individually or viewed on an office wallboard – all employees from Engineering, Marketing, Sales and Finance can stay up to date with latest sales performance data.
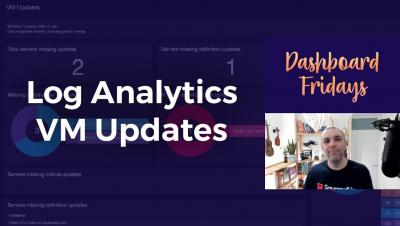
Join Adam Kinniburgh in this latest Dashboard Fridays episode, in which he showcases this VM Updates dashboard, built with the WebAPI tile for the CE and SCOM editions. Since there is a native connection to the Log Analytics workspace in the Azure edition, here it is created using the native Logs tile. This dashboard surfaces key metric data for Virtual Machines, regardless of where the servers are hosted.
Join Adam Kinniburgh in this latest Dashboard Fridays episode, in which he showcases a Log Analytics VM Insights dashboard. This dashboard, built with the WebAPI tile for the CE and SCOM editions of SquaredUp, surfaces key metric data for Virtual Machines, regardless of where the servers are hosted. In this short video, we'll demonstrate how this dashboard was built using SquaredUp dashboards, the challenges it solves, and how you can easily replicate it in your own environment.