Operations | Monitoring | ITSM | DevOps | Cloud

January 2021

Building powerful tailored SCOM dashboards with Enterprise Applications (Part 2)

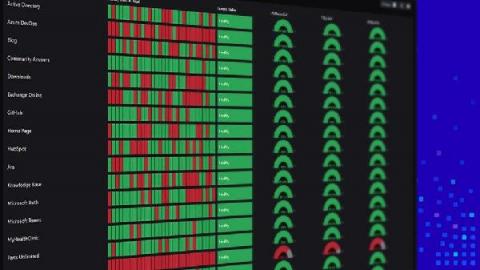
In my last blog post, we focused on creating 29 Enterprise Applications (EA). We also spent some time talking about our Critical Service Offerings (CSO) and Supporting Service Offerings (SSO). And finally, we looked at three out-of-box dashboards. If all you needed was to create a dashboard to control the boxes’ color quickly, you already have what you need.

Better Dashboarding - Grafana or SquaredUp?

As part of my job as a tech evangelist and a pre-sales engineer here at SquaredUp, I often find myself talking to a lot of people. And understandably, when you as a consumer are trying to evaluate a product that you may potentially invest in, it’s only natural that you want to compare different products and decide which one’s better and/or offers more value for money and why.

Building powerful tailored dashboards: end users, management, infrastructure

In my position, I get to work with a wide variety of organizations that each have a different level of monitoring maturity. But I’ve noticed an emerging pattern that I’ll call the ‘Critical Service Offering’ or ‘Executive Level Status’ dashboard. At their most basic level, these dashboards should communicate the current health of the application, provide some historical context and, most importantly, not be tied to infrastructure monitoring.

Building powerful tailored SCOM dashboards with Enterprise Applications (Part 1)

In my position, I get to work with a wide variety of organizations that each have a different level of monitoring maturity. But I’ve noticed an emerging pattern that I’ll call the ‘Critical Service Offering’ or ‘Executive Level Status’ dashboard. At their most basic level, these dashboards should communicate the current health of the application, provide some historical context and, most importantly, not be tied to infrastructure monitoring.

Kusto: Table Joins and the Let Statement

In this article I’m going to discuss table joins and the let statement in Log Analytics. Along with custom logs, these are concepts that really had me scratching my head for a long time, and it was a little bit tricky to put all the pieces together from documentation and other people’s blog posts. Hopefully this will help anyone else out there that still has unanswered questions on one of these topics.

Kusto: Custom Logs in Log Analytics

In this article, I’m going to discuss custom logs in Log Analytics. Along with table joins and the let statement that I discuss in another blog, custom logs is a concept that I struggled to wrap my head around for a long time, as there don’t seem to be very many comprehensive guides out there as of yet. Here is a summary of everything I have managed to piece together from documentation and other people’s blog posts.

How to build the ideal dev team dashboard

So you’ve now finally finished putting all the pieces together – transitioned to Azure, deployed resources, deployed applications, got familiar with Azure Monitor and set up all the monitoring. You’re now collecting all the monitoring, application performance and security data for your Azure resources in Log Analytics workspaces, ready for analysis. (Head over to our Azure Monitor Learning Path if you're still figuring out how to do all that.) But is only the collection enough?

Looking ahead: SquaredUp 5.0 and beyond

Welcome to 2021, a year we are all entering full of hope. None of us knows quite what 2021 holds in store with regards to the global pandemic, but no doubt it will be another year of huge change. That will mean continued pressure on IT organizations across all industries to adapt and deliver new services to the business and users, all while keeping costs as low as possible. As we start a new year, many of you reading this will be considering your monitoring strategy in 2021 and beyond.

Working with On-prem machines in SquaredUp for Azure

If you’ve been using SquaredUp for Azure, you’re familiar with its abilities to treat Azure native virtual machines . You can create a number of amazing and useful visualizations with them, such as displaying their health state, performance charts, costs, and so on. This is all excellent and super useful, but one question we frequently get asked is: how do I do these things with my on-prem servers that I’ve connected to Azure Monitor?

Introducing Azure Management Talk

Happy New Year everyone! We are thrilled to be starting 2021 with some exciting news. Come February 2nd, we’ll be kicking off Azure Management Talk, a bite-sized webinar series with a focus on all things Azure management. Azure is fast-evolving, and often, it can get quite complicated. With so many things to learn and not enough time, the huge swathes of learning resources available online can quickly get overwhelming.