Operations | Monitoring | ITSM | DevOps | Cloud

December 2020

On/Off NOC Dashboards with SquaredUp

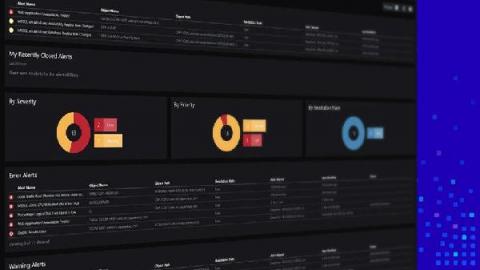
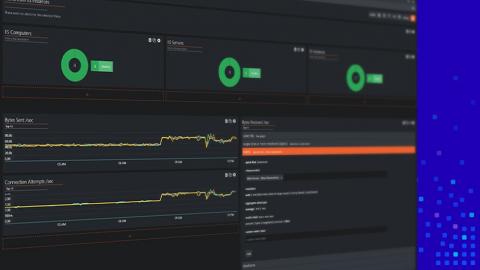
How do you define your workday? You walk into your office, grab a coffee, turn on your laptop and take a look at your central source of information – often dashboards – to glance at things happening overall, tasks assigned to you and sketch your schedule accordingly. A lot of our customers we talk to share a routine like this, and SquaredUp dashboards are often their one-stop-shop for consuming alerts/tasks that need their attention.

Why choose the Connect license for SquaredUp 5.0?

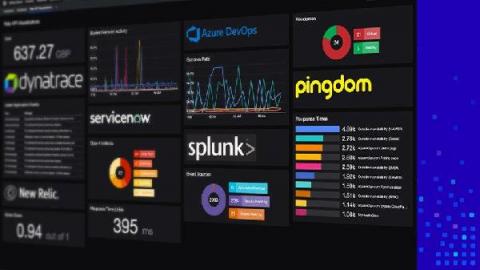
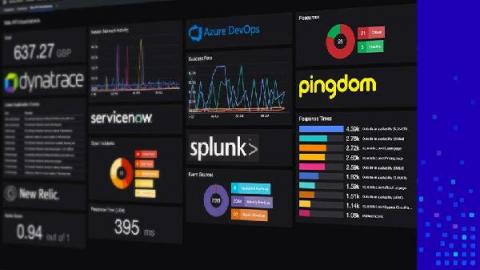
Every enterprise has its arsenal of tech tools to tackle an array of different challenges. Useful, and necessary, but often a pain to monitor. Whatever your data sources, being able to bring all these metrics into a unified dashboard provides valuable context, which in turn helps you identify and correlate problems more quickly, resulting in improved reaction time and decision making.

New and improved Web API tile with SquaredUp 5.0

Being able to visualize data from all of your tools in a unified dashboard experience has become critical to most enterprises today. With SquaredUp dashboards, you can not only correlate data from SCOM and Azure, but also surface critical information from your other tools and data sources – including ServiceNow, Azure Log Analytics, App Insights, all SQL databases and any Web API. In short, you can get unified dashboards with real-time operational intelligence for all teams across all tools.

New Open Access with SquaredUp 5.0

Our Open Access feature enables easy, and unlimited sharing of dashboards across your organization – with any audience at all. A highly popular feature, these shared dashboards help you bring better visibility and collaboration – conveying the shared “truth”! With our latest release SquaredUp 5.0, we have made Open Access dashboards fully interactive, like the rest of our dashboards, so you can see that next level of detail you’ve been wanting.

Improved Dashboard Designer experience with SquaredUp 5.0

At SquaredUp, we are all about dashboards and visualizations that enable you to build the ideal single pane of glass. If you work in monitoring, you know that designing the perfect dashboards that give you all of your important metrics at a glance, is easier said than done. Most of the time, it takes several attempts to optimize a dashboard for easy reading, and more often than not, this step is neglected. I wouldn’t recommend skipping over this step though.

Control access with Teams Folders

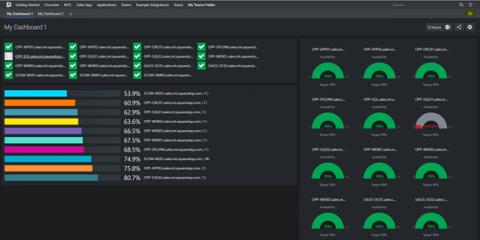
If you work in monitoring, you know how important it is for the right people to see the right data. Too much irrelevant data creates a flurry of alerts that hinders productivity, and missing out on key data leads to visibility issues. Worst of all is when you get the wrong people tinkering with data that belongs to other teams.

Get the full picture with SquaredUp's ServiceNow Tile (Part 2)

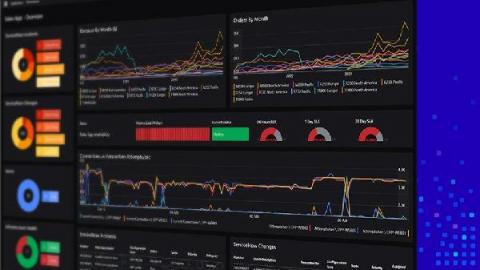
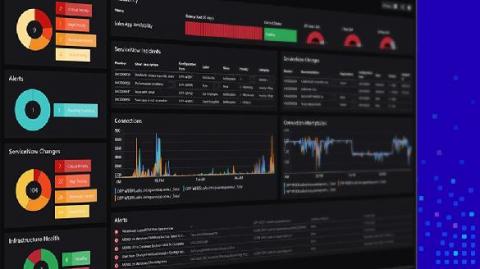
As a systems admin, chances are you’ve got a whole host of monitoring tools and data sources to keep track of: ServiceNow, SCOM, Splunk, Solarwinds, plus your APM and CI/CD tools too. With SquaredUp, you can get a single pane of glass, surfacing your ServiceNow ITSM data alongside data from these other techstacks too! For an introduction on how to get the full picture of your ServiceNow data, head over to Part 1 of our ServiceNow Tile blog series.