Operations | Monitoring | ITSM | DevOps | Cloud

November 2020

What is a single pane of glass?

There’s a new Azure agent in town – Azure Monitor Agent (AMA). I hear you saying, “Wait, aren’t there already enough Azure agents? So why another new agent?” A very valid question! Indeed, there are already a few Azure monitoring agents: the Log Analytics Agent, the Diagnostic Extension agent, and the Telegraf agent (and also the Dependency agent if you want to count it separately).

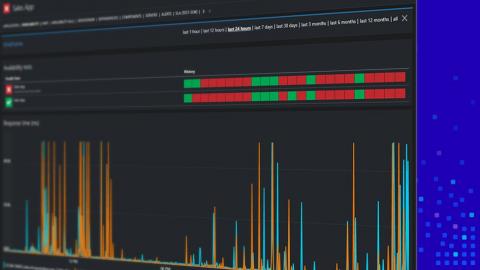
Set up Availability Monitoring from the End Users Perspective

A recurring theme of modern monitoring tools is that they focus on the user, not the systems. To put it another way, while monitoring your infrastructure is essential, it matters more when your customers can’t interact with your application. That would mean lost sales, lost time, unhappy people – and unfortunately for us, unhappy people like to share how grumpy they are. It’s bad for business! But that’s why we’ve made Availability Monitoring in SquaredUp.

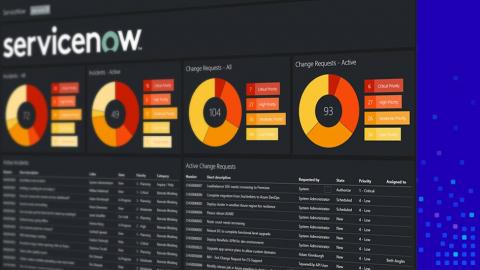
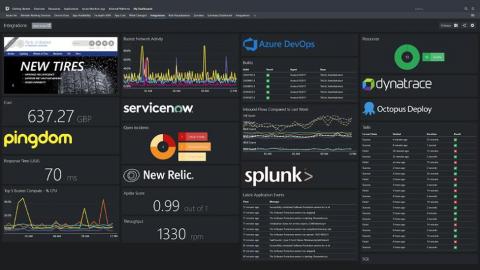
Get ServiceNow data alongside SCOM, Pingdom and more

For those on an ITIL journey, ServiceNow appears to be the service to beat. ServiceNow has tremendous flexibility and thousands of different workflows to support your business. And if you’re using SCOM to populate your CMDB, you’re leaps and bounds ahead of the average organization. Sadly, that flexibility comes with the cost of being stuck inside of the ServiceNow web interface.

SquaredUp 5.0 is coming And it will be bigger and better than ever before!

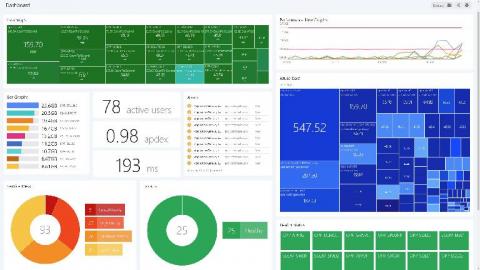
As the year draws to a close, we’ve got exciting news. In the new year, we will be launching SquaredUp version 5.0! So, what exactly is in this big, bold update, you ask? Expect a gorgeous new look and feel plus major improvements to our two most popular features – Open Access and Dashboard Designer. We’re also bringing you even more visualizations for your Web API integrations, so you can display data in the best possible way in your single pane of glass. The best part?

Why SCOM needs SquaredUp: Performance monitoring reporting

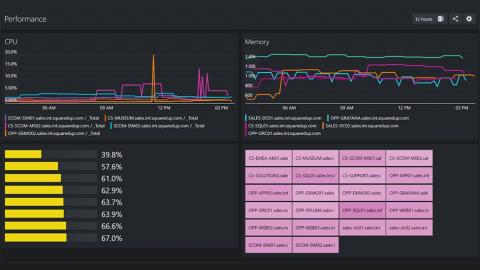
As a SCOM admin, you’re probably heavily involved with alert analysis and performance monitoring. You probably also know then, that while SCOM is a great monitoring tool, it leaves a lot to be desired when it comes to reporting on performance monitoring. I’ve got good news for you. SquaredUp sits on top of SCOM and completely changes the game. How? Why? Read on for a comparison and break down of all the reasons you should do it with SquaredUp.

Get the full picture with SquaredUp's ServiceNow Tile (Part 1)

ServiceNow is one of the most widely deployed ITSM tools within enterprise IT environments, and for good reason – they provide a highly customisable platform that allows organisations build the tools they need to their exact requirements. But you’ve got more than ServiceNow to manage and monitor – there’s SCOM, Splunk, and Solarwinds monitoring your infrastructure, also your APM and CI/CD tools too.

Get detail AND insight from your metrics

We who use SCOM know about its extensive monitoring capabilities, but the static nature of the SCOM console is not one of its strong points. You can’t drill down to see the data, or correlate data with other data types or alerts for the same object. To the delight of our customers, SquaredUp allows you to do all that and much more – so that you can get all the detail and insight you need, from the metrics you are already collecting.

Reduce monitoring silos with SquaredUp WebAPI and SQL tiles

SCOM is a great solution to monitor your infrastructure. Everything you need for in-depth monitoring is provided out-of-box or with a dedicated management pack. If your organization is genuinely invested with SCOM, you probably also know that you can get in-depth monitoring with SCOM’s Application Performance Monitoring (APM) functionality, and collect events across your servers with SCOM’s Audit Collection Services (ACS).

Incident response: Is MTTI the metric that matters most?

We all know that SCOM is a monitoring powerhouse, but even the biggest SCOM fan can’t deny that the SCOM Console dashboards leave much to be desired. They might look colorful, but unfortunately there’s not much else they can do. You can’t drill down further into an object, and you definitely can’t correlate it with other data you might have on that object that could be related.