Operations | Monitoring | ITSM | DevOps | Cloud

Linux

NiCE Linux Power MP 1.00 released

Speed up your IBM Power servers like never before. In IBM Power System environments, processing time is costly and is measured in work units. A CPU hog on any Linux server can become expensive. Under-provisioned systems react slowly on queries from business applications, which then cause undesired end user or processing delays. As IBM Power servers typically run business critical workloads, response time and availability is key.

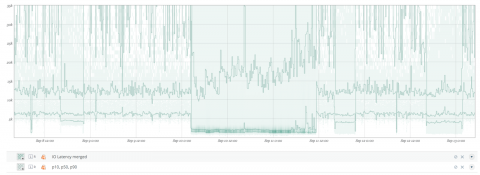
Which block I/O scheduler is the best? We asked eBPF

eBPF tracing is a broad and deep subject, and can be a bit daunting at first sight. However, when Brendan Gregg issued the dictum “Perhaps you’d like a new year’s resolution: learn eBPF!”, I figured it was as good a time as any to do something fun with it. Here at Circonus, we’ve talked about eBPF previously, so I had a starting point to look for an interesting problem to solve.

Free Linux logs analytic app - get Linux logs insights automatically!

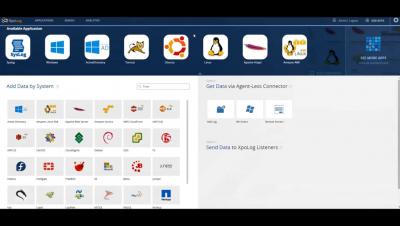
The New Linux Log Analysis & Monitoring App will automate your entire Log Management lifecycle. 3 short steps - 1. Add data 2.Deploy the app & 3.Gain insight. https://lp.xpolog.com/linux-logs-app/ The app uses machine-learning and NLP analysis to mark errors and possible problems from the collected Linux logs.

XpoLog Announces: New Analytics App for Linux Logs

XpoLog 7 brings your data into a new age of log analysis and management. While the industry is focused on developing advanced search abilities and simplifying log analysis, nobody has been able to resolve the persistent issues of the long, complex and tedious deployments. Up until today! XpoLog 7 is proud to offer full automation of the entire log management lifecycle!

Linux System Monitoring with eBPF

The Linux kernel is an abundant component of modern IT systems. It provides the critical services of hardware abstraction and time-sharing to applications. The classical metrics for monitoring Linux are among the most well known metrics in monitoring: CPU utilization, memory usage, disk utilization, and network throughput. For a while now, Circonus installations have organized, the key system metrics in the form of a USE Dashboard, as a high level overview of the system resources.