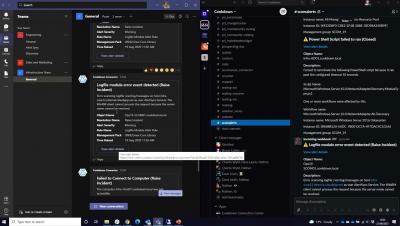
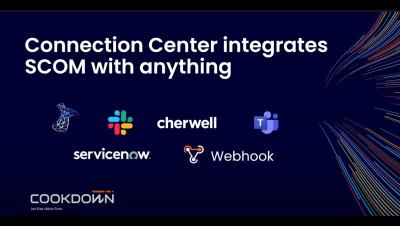
Operations | Monitoring | ITSM | DevOps | Cloud

NinjaRMM is now NinjaOne

NinjaRMM is now NinjaOne. With NinjaOne, IT teams can automate, manage, and remediate all their IT tasks within one intuitive platform. Making IT teams more efficient and your users more productive. NinjaOne is a unified IT operations platform that combines endpoint management, patching, ticketing, backup, remote control and so much more. NinjaOne supports over 6,000 MSPs and IT departments around the world, and is consistently ranked #1 for it’s world-class customer support, and ease-of-use.

Deploy Friday: E77 Simplifying local development with Lando

DevOps isn’t just where your application is delivered, how it's tested, or how you end up provisioning remote development environments for it. Local development solutions are paramount, but like everything else, there are a ton of options with slightly different assumptions and philosophies for how your work is supported.

Investigate an error with Rollbar

Investigate an error with the help of Rollbar, leveraging item details, traceback, suspect deploy, people tracking, and the rich contextual data available in the UI. Rollbar is the leading continuous code improvement platform that proactively discovers, predicts, and remediates errors with real-time AI-assisted workflows. With Rollbar, developers continually improve their code and constantly innovate rather than spending time monitoring, investigating, and debugging.

Next Generation Slack Migration Tool and Stakeholder Updates Demo

Learn more about PagerDuty's Collaboration Applications that help you streamline incident remediation. Enjoy these demos of our latest updates to our PagerDuty Slack and Microsoft Teams Applications including the Webhook Migration Tool, Stakeholder Updates, and Resolution Notes.

Intro to Netdata Overview for monitoring and troubleshooting your IT infrastructure

Learn how to get started monitoring and troubleshooting your entire Cloud infrastructure with Netdata. In this video, we'll show you how to utilize the Netdata Overview dashboard to gain visibility into the performance, availability, and health of your infrastructure from a single pane of glass. Navigate from a real-time, unified display of all your systems and applications to discover trends and gain better observability, then drill down by grouping metrics by node for root cause analysis.