Introducing Anomaly Advisor for troubleshooting at scale
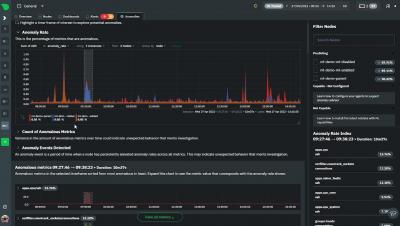
Troubleshoot at scale with our all-new, lightweight Anomaly Advisor, powered by machine learning. The Anomaly Advisor finds periods of time with elevated anomaly rates across your entire infrastructure faster than ever before. This new feature works along with our ML unsupervised models on the edge, making your troubleshooting trouble-free! Even better, the Anomaly Advisor requires minimal configuration and is extremely lightweight. No need to worry about exhausting your CPU usage.