Operations | Monitoring | ITSM | DevOps | Cloud

Latest Posts

Grafana Labs bug bounty: What you need to know about our new partnership with Intigriti

Grafana Labs is happy to announce that we have partnered with Intigriti, a leading bug bounty platform, to expand our bug bounty program. This collaboration will enable us to work more effectively with security researchers from around the world in a scalable, sustainable way. Moving to a platform that handles initial triage will allow us to focus on valid reports and expand our scope, covering a wider range of Grafana Labs developed products and services.

How to set up Grafana Mimir using Ansible

Gerard van Engelen is a seasoned DevOps engineer who ensures the quality of products by drawing parallels between complex issues and simpler, everyday scenarios. This approach helps in delivering value, ensuring that products are not only built correctly but also offer the right functionalities. Ansible is popular with system administrators and DevOps professionals who use it for automating IT tasks such as configuration management, application deployment, and orchestration.

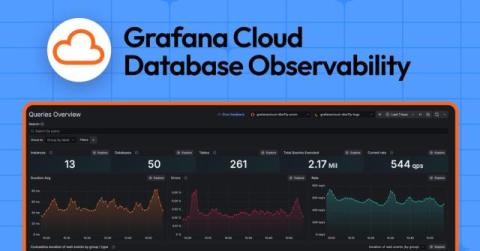
How to set up an open source database monitoring stack with Grafana Cloud

One of the great powers of Grafana is the open source community behind it — a community that provides a breadth of ready-to-use dashboards, plugins, exporters, and instructions that make a million tasks easier. The sheer scale of it all means whatever you need probably already exists somewhere. To illustrate this, I want to share an example of how to use these tools as a base for building a comprehensive database monitoring solution.

How Mux cut metrics volume by 60%, increased retention times, and improved developer productivity with Grafana Cloud

Every time the platform engineering team at San Francisco-based startup Mux deploys new software, there are two must-have components: proper access controls and observability. But until recently, their observability stack left the team frustrated, reactive, and largely in maintenance mode.

A complete guide to LLM observability with OpenTelemetry and Grafana Cloud

In the fast-paced world of technology, change is constant — and nowhere is that more evident today than in the flood of new features and advancements involving large language models (LLMs). They power various applications, from chat bots to advanced copilots. And as these LLMs and applications become more sophisticated, it will be vital that they work well and reliably. This is where observability, with the help of OpenTelemetry (using OpenLIT), plays an essential role.

The new, queryless UI for Grafana Pyroscope: Introducing Explore Profiles

We are excited to share a significant update for Grafana Pyroscope users and the broader open source community: the launch of Explore Profiles, a new application that makes it easier and faster to surface meaningful insights from your profiling data. Explore Profiles is a Grafana app plugin designed to integrate seamlessly with Grafana Pyroscope, the open source continuous profiling backend, providing a smooth, queryless experience to browse and analyze your profiling data.

Get insights from logs without writing a query: Explore Logs is in Public Preview

Whether it’s 3 in the morning and you’re trying to resolve an outage, or you’re testing a new feature and you need to resolve a recurring issue so you can move on to your next task: time is of the essence. Wouldn’t it be great if your observability tooling could direct you to your “aha” moment, without you needing to fumble with writing a query?

Grafana Cloud updates: Kubernetes Monitoring enhancements, browser tests in Grafana Cloud k6, and more

We consistently roll out helpful updates and fun features in Grafana Cloud, our fully managed observability platform powered by the open source Grafana LGTM Stack (Loki for logs, Grafana for visualization, Tempo for traces, and Mimir for metrics). In case you missed it, here’s a roundup of the latest and greatest updates for Grafana Cloud this month. You can also read about all the features we add to Grafana Cloud in our What’s New in Grafana Cloud documentation.

Performance testing with Grafana k6 and GitHub Actions

By running performance tests continuously and automatically, you can identify and correct performance regressions as they occur. One way to do this is by integrating performance testing into your development process. In this step-by-step post, we explore how to do just that, using Grafana k6 and GitHub Actions. k6 is an open source load testing tool to test the performance of APIs, microservices, and websites.

Observing exchange rates: How to keep tabs on currencies during the summer travel season

It’s summertime in the Northern Hemisphere, and for many people that means it’s also travel season. But before you depart for your dream holiday, don’t forget the essentials: passport, suitcase, and … Grafana? That’s right. If you’re headed to a different country, odds are you’ll use a different currency when you get there. And you can use Grafana to track changes in the exchange rates so you can get the most bang for your buck.