Follow Ethan Keaton Manager of Technical Marketing as he walks you through installing Graylog V6.1 with Graylog Data Node. Graylog Data Node is a Graylog managed OpenSearch Service.
Mainframe systems may be the workhorses of many enterprises, but let’s face it, modernization is long overdue for most organizations. With decades-old infrastructure running mission-critical workloads, updating these systems isn’t just about keeping up with the times—it’s about ensuring that your business remains agile, competitive, and efficient. And a big part of this journey? MQ infrastructure. They form the backbone of communication between mainframes and newer technologies.
Metrics as a Service (MaaS) offers a scalable, cloud-based solution for collecting, storing, and analyzing performance data. By leveraging MaaS platforms, organizations can gain valuable insights into their systems’ behavior and optimize their operations.
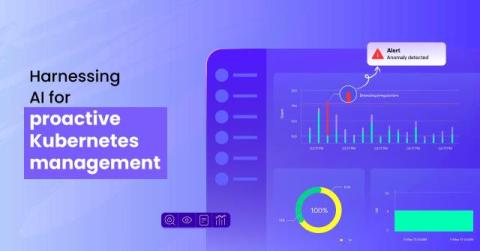
In a dynamic environment like Kubernetes, where manual tracking is impossible, AI-powered monitoring tools, such as Site24x7, surf through enormous amounts of data, detecting irregularities, predicting vulnerabilities, and alerting the user about a possible outage that is about to happen if the resource is not handled.
In today’s fast-paced world, time is money. The faster we can resolve one client’s issue, the quicker we can move on to the next, boosting client satisfaction and maximizing operational efficiency. However, the journey from identifying a problem to resolving it is often prone to delays and human errors. That’s why having an efficient, reliable and fast alert notification process is crucial for driving customer satisfaction and ensuring cost savings.
Modern businesses rely on a variety of external services to support their operations, including APIs, cloud platforms, CDNs, payment gateways, and more. Whether it's pulling data from an external API, using a cloud service for storage, or integrating a third-party tool for analytics, these services help achieve many business objectives. Given their criticality, it’s important to have a reliable mechanism for monitoring external services.
Logs are a rich source of information, providing you with the minute details you need to troubleshoot a specific issue or perform extensive historical analysis. But with billions of logs being generated from your infrastructure every day, it isn’t practical to sift through them all to derive actionable insights. Firewall, CDN, network activity, and load balancer logs are especially high volume, requiring storage solutions that can be expensive and difficult to scale.
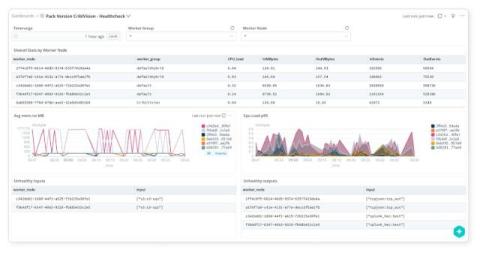
Our new Cribl Search Packs give you a framework for packaging, sharing, and installing config bundles that align with a given data source or use case. Similar in concept to our original Cribl Stream Packs framework, Cribl Search Packs help users find value in their datasets more quickly across common use cases. In fact, Stream Pack users were a powerful driver in the development of Search Packs.
Let’s be real, we’ve never been huge fans of conventional unstructured logs at Honeycomb. From the very start, we’ve emitted from our own codestructured wide events and distributed traces with well-formed schemas. Fortunately (because it avoids reinventing the wheel) and unfortunately (because it doesn’t adhere to our standards for observability) for us, not all the software we run is written by us.