What is Open Telemetry?
What is Open Telemetry? Open Telemetry is a project that helps you instrument systems to see what's going on under the hood.


At Grafana Labs, open source has always been part of our DNA. But in 2023 — a year in which we reflected on 10 years of Grafana, among other major OSS milestones — the power of our open source community felt especially palpable.
Hello again, folks! It sure has been a while. For those of you who know me, you may remember I used to work at SquaredUp as a tech evangelist until a couple of years ago. Then some things happened, and I left in pursuit of something else. However, life has come full circle after about 2 years and boy am I glad to be back!
Welcome to Part 2 of the “Concise guide to Loki,” a multi-part series where I cover some of the most important topics around our favorite logging database: Grafana Loki. As I reflect on the fifth anniversary of Loki, it felt like a good opportunity to summarize some of the important parts of how it works, how it’s built, how to run it, etc. And as the name of the series suggests, I’m doing it as concisely as I can.
Everyone has their own toys to play with this Christmas, but we all have more fun when we share. The same applies to the tools we use, the data we collect, and the insights we act on. In this video, I'll show you how one of our valued (and definitely real) customers “North Pole Industries” utilizes SquaredUp to share the magic of observability.
If you ask us to score 2023, we would give it a 10 out of 10. Not only because we released Grafana 10 and celebrated the 10-year anniversary of the Grafana project with the first-ever Golden Grot Awards and the launch of a four-part documentary series.
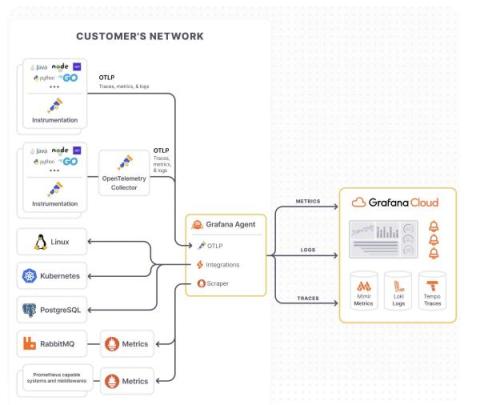
If you’ve landed on this blog, you’re likely either considering starting your OpenTelemetry journey or you are well on your way. As OpenTelemetry adoption has grown, not only within the observability community but also internally at Grafana Labs and among our users, we frequently get requests around how to best implement an OpenTelemetry strategy.